
Concept explainers
Videos
Experts fear that without conservation efforts, tigers could disappear from the wild by 2022. Just one hundred years ago, there were at least 100,000 wild tigers. By 2010, the estimated world tiger population was 3200. The bar graph shows the estimated world tiger population for selected years from 1970 through 2010. Also shown is a polynomial function, with its graph, that models the data. Use this information to solve Exercises 73-74.
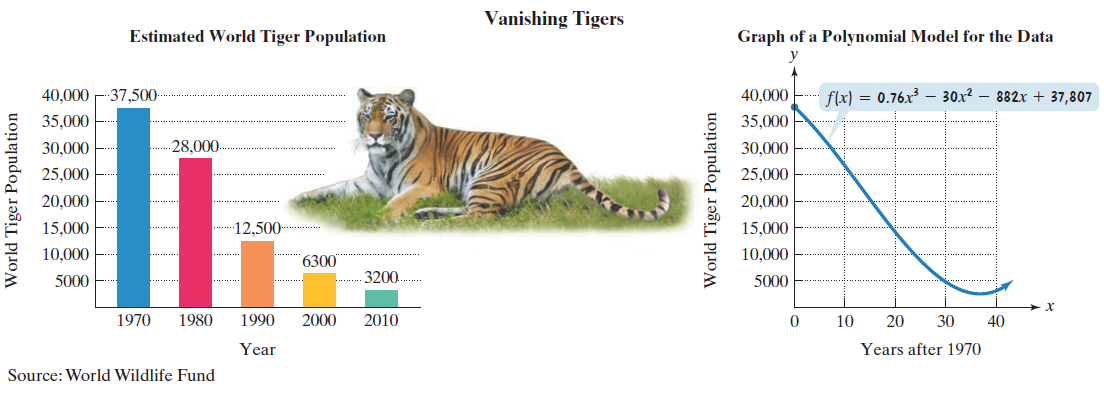
a. Find and interpret f (40). Identify this information as a point on the graph of. f
b. Does f (40) overestimate or underestimate the actual data shown by the bar graph? By how much?
c. Use the Leading Coefficient Test to determine the end behavior to the right for the graph of f Will this function be useful in modeling the world tiger population if conservation efforts to save wild tigers fail? Explain your answer.
Want to see the full answer?
Check out a sample textbook solution
Chapter 2 Solutions
Precalculus (6th Edition)


- Explain the conditions under Radius of Convergence which of Power Series is 0arrow_forwardExplain the key points and reasons for 12.8.2 (1) and 12.8.2 (2)arrow_forwardQ1: A slider in a machine moves along a fixed straight rod. Its distance x cm along the rod is given below for various values of the time. Find the velocity and acceleration of the slider when t = 0.3 seconds. t(seconds) x(cm) 0 0.1 0.2 0.3 0.4 0.5 0.6 30.13 31.62 32.87 33.64 33.95 33.81 33.24 Q2: Using the Runge-Kutta method of fourth order, solve for y atr = 1.2, From dy_2xy +et = dx x²+xc* Take h=0.2. given x = 1, y = 0 Q3:Approximate the solution of the following equation using finite difference method. ly -(1-y= y = x), y(1) = 2 and y(3) = −1 On the interval (1≤x≤3).(taking h=0.5).arrow_forward
- Consider the function f(x) = x²-1. (a) Find the instantaneous rate of change of f(x) at x=1 using the definition of the derivative. Show all your steps clearly. (b) Sketch the graph of f(x) around x = 1. Draw the secant line passing through the points on the graph where x 1 and x-> 1+h (for a small positive value of h, illustrate conceptually). Then, draw the tangent line to the graph at x=1. Explain how the slope of the tangent line relates to the value you found in part (a). (c) In a few sentences, explain what the instantaneous rate of change of f(x) at x = 1 represents in the context of the graph of f(x). How does the rate of change of this function vary at different points?arrow_forward1. The graph of ƒ is given. Use the graph to evaluate each of the following values. If a value does not exist, state that fact. и (a) f'(-5) (b) f'(-3) (c) f'(0) (d) f'(5) 2. Find an equation of the tangent line to the graph of y = g(x) at x = 5 if g(5) = −3 and g'(5) = 4. - 3. If an equation of the tangent line to the graph of y = f(x) at the point where x 2 is y = 4x — 5, find ƒ(2) and f'(2).arrow_forwardDoes the series converge or divergearrow_forward
- Suppose that a particle moves along a straight line with velocity v (t) = 62t, where 0 < t <3 (v(t) in meters per second, t in seconds). Find the displacement d (t) at time t and the displacement up to t = 3. d(t) ds = ["v (s) da = { The displacement up to t = 3 is d(3)- meters.arrow_forwardLet f (x) = x², a 3, and b = = 4. Answer exactly. a. Find the average value fave of f between a and b. fave b. Find a point c where f (c) = fave. Enter only one of the possible values for c. c=arrow_forwardplease do Q3arrow_forward
 Algebra & Trigonometry with Analytic GeometryAlgebraISBN:9781133382119Author:SwokowskiPublisher:Cengage
 College Algebra (MindTap Course List)AlgebraISBN:9781305652231Author:R. David Gustafson, Jeff HughesPublisher:Cengage Learning

 Glencoe Algebra 1, Student Edition, 9780079039897...AlgebraISBN:9780079039897Author:CarterPublisher:McGraw Hill
 Big Ideas Math A Bridge To Success Algebra 1: Stu...AlgebraISBN:9781680331141Author:HOUGHTON MIFFLIN HARCOURTPublisher:Houghton Mifflin Harcourt