
Concept explainers
To sketch: A Venn diagram and shade the section
Answer to Problem 2TTO
A required Venn diagram as shown below.
Explanation of Solution
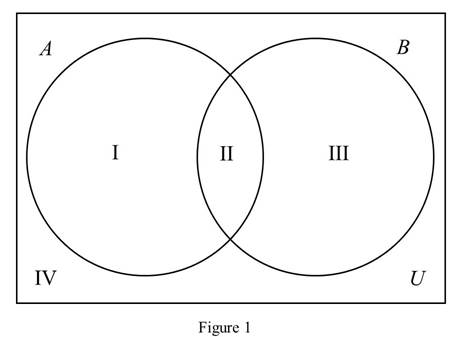
Step 1:
Draw a Venn diagram and name each area with a Roman numeral.
Step 2:
From the Venn diagram, list the regions that make up each set.
Step 3:
Compute
The regions I and II are in
Therefore, the regions III and IV are not in A.
That is, the complement of A is III and IV.
That is,
The region II, III and IV are in either
That is,
Step 4:
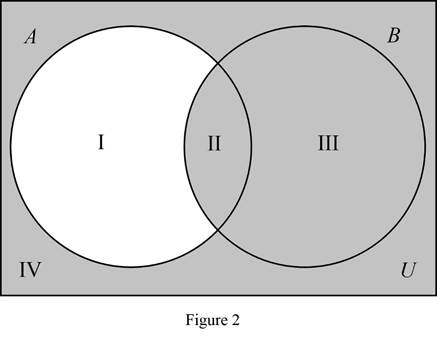
By step 3, shade the region II, III and IV as shown in below Figure 2.

From the Figure 2, it is observed that shaded regions represents
Want to see more full solutions like this?
Chapter 2 Solutions
Quantitative Literacy (Loose Leaf) with Connect Math Hosted by ALEKS Access Card


- Suppose that a particle moves along a straight line with velocity v (t) = 62t, where 0 < t <3 (v(t) in meters per second, t in seconds). Find the displacement d (t) at time t and the displacement up to t = 3. d(t) ds = ["v (s) da = { The displacement up to t = 3 is d(3)- meters.arrow_forwardLet f (x) = x², a 3, and b = = 4. Answer exactly. a. Find the average value fave of f between a and b. fave b. Find a point c where f (c) = fave. Enter only one of the possible values for c. c=arrow_forwardThe following data represent total ventilation measured in liters of air per minute per square meter of body area for two independent (and randomly chosen) samples. Analyze these data using the appropriate non-parametric hypothesis testarrow_forward
- each column represents before & after measurements on the same individual. Analyze with the appropriate non-parametric hypothesis test for a paired design.arrow_forwardShould you be confident in applying your regression equation to estimate the heart rate of a python at 35°C? Why or why not?arrow_forwardGiven your fitted regression line, what would be the residual for snake #5 (10 C)?arrow_forward
- Calculate the 95% confidence interval around your estimate of r using Fisher’s z-transformation. In your final answer, make sure to back-transform to the original units.arrow_forwardCalculate Pearson’s correlation coefficient (r) between temperature and heart rate.arrow_forwardCalculate the least squares regression line and write the equation.arrow_forward
 Elementary Geometry For College Students, 7eGeometryISBN:9781337614085Author:Alexander, Daniel C.; Koeberlein, Geralyn M.Publisher:Cengage,
 Elementary Linear Algebra (MindTap Course List)AlgebraISBN:9781305658004Author:Ron LarsonPublisher:Cengage Learning
 Elements Of Modern AlgebraAlgebraISBN:9781285463230Author:Gilbert, Linda, JimmiePublisher:Cengage Learning,