Sub part (a):
The Gini ratio.
Sub part (a):
Explanation of Solution
Figure 1 illustrates the Lorenz curve.
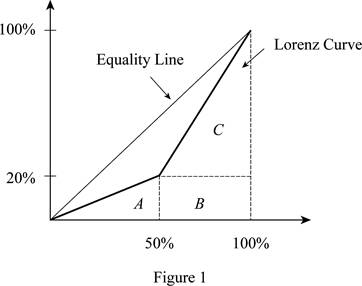
In Figure 1, the horizontal axis measures the percentage of population and the vertical axis measures the percentage of income. In this, we find the area under the Lorenz curve. Thus, the area of triangle can be calculated as follows:
Thus, the area of triangle is 500.
The base of the triangle is 50 (at 50%) because there are only two people in the economy. The height of the triangle is 20 (at 20%) because the lowest income is $20,000, which is 20% of the total income earned in society (= ($20,000 / $100,000) x 100).
The area of the rectangle of B can be calculated as follows:
Thus, the area of the rectangle B value is 1,000.
The area of the rectangle of C can be calculated as follows:
The area of triangle C is 2,000.
The total area under the Lorenz curve can be calculated as follows:
The total area value is 3,500.
The Gini ratio can be calculated as follows:
Thus, the Gini ratio is 0.300.
Concept introduction:
Gini ratio: It is a measure of statistical scattering that is intended to represent the income distribution of a nation's residents and is most commonly used to measure inequality.
Lorenz curve: It is the graphical illustration of the income distribution or of the wealth.
Sub Part (b):
The Gini ratio in the scenario 2.
Sub Part (b):
Explanation of Solution
After the tax and redistribution program Larry's new income is $40,000 and Roger's new income is $60,000. This implies that Larry (50% of the population) now controls 40% of the society's income rather than the 20% before the program.
The area of the triangle A can be calculated as follows:
The value of the triangle area is 1,000.
The value of rectangle B can be calculated as follows:
The area of rectangle B is 2,000.
The area of rectangle C can be calculated as follows:
The area of triangle C can be calculated as follows:
The total area under the Lorenz curve can be calculated as follows:
The total area value is 4,500.
The Gini ratio can be calculated as follows:
Thus the Gini ratio here is 0.100.
Concept introduction:
Gini ratio: It is a measure of statistical scattering that is intended to represent the income distribution of a nation's residents and is most commonly used to measure inequality.
Lorenz curve: It is the graphical illustration of the income distribution or of the wealth.
Sub part (c):
Change in the Gini ratio with change in income.
Sub part (c):
Explanation of Solution
If the income is double, Larry will earn $40,000 and Roger will earn $160,000. The total income in society is now $200,000. Larry still only controls 20% of the society's income ((=$40,000/$200,000) x 100).
Since the doubling of income does not change the percentage of income that is controlled by Larry (or Roger) , the Gini ratio will not change. Thus, the answer will be the same as in part 'a' at 0.300. Thus, the Gini ratio remains the same as it was before and after the income doubles.
Want to see more full solutions like this?

- how to solve the attachment?arrow_forwardProblem 3-ABC Challenges: Attrition, Balance and ComplianceCan television inform people about public affairs? Political scientists Bethany Albertson and Adria Lawrence (2009) conducted an experiment in which they randomly assigned people to treatment and control groups to evaluate the effect of watching TV on a person’s information level. Those assigned to the treatment group were told to watch a specific television broadcast and were later asked questions related to what they watched. Those in the controlgroup were not shown the TV broadcast but were asked questions related to the material in the TV broadcast. The dataset contains the following variables: : Dummy variable which =1 if a person reads news and 0 otherwise. : interest in political affairs (not interested=1 to very interested=4) : years of education : female dummy variable (female=1; male=0) : family income in thousands of dollars : information level (low information level=1 to high information level=4) =1 if the…arrow_forwardProblem 2-Experiments/Randomized Control Trial Suppose you are interested in studying the effect of academic counselling on the years it takes for a student to obtain an undergraduate degree. You conduct a randomized control trial to answer the question. You randomly assign 2500 individuals in a university in New York to receive academic counselling and 2500 students to not receive any academic counselling. a. Which people are a part of the treatment group and which people are a part of thecontrol group? b. What regression will you run? Define the variables where required. c. Suppose you estimate = -0.3. Interpret it. d. You test for balance using the variables mentioned in the table below. Based on the results do you think that the treatment and control group are balanced? If your answer is “yes” then explain why. If your answer is “no”, then explain why and mention how will you address the issue of imbalance. e. Suppose that some unmotivated students in the control group decided to…arrow_forward
- How to calculate total cost?arrow_forwardProblem 1-Experiments/Randomized Control TrialSuppose you are interested in studying the effect of being a part of the labor union on anindividual’s hourly wage.You collect data on 1000 people and run the following regression. where is a dummy variable which is equal t to 1 for people who are a part of labor union and0 for others. a. Suppose you estimate . Interpret b. Do you think is biased or unbiased? Explain. Now suppose you conduct a randomized control trial to answer the same question. Yourandomly assign some individuals to be a part of the labor union and others to not be a partof the labor union. The first step you take is to ensure that the randomization was donecorrectly. Then you estimate the following equation: =1 if the student is assigned to be a part of Labor Union=0 if the student is assigned to not be a part of Labor Union c. Why is it important to ensure that the randomization is done correctly? d. Name any two variables that you can use to test if Treatment and…arrow_forwardWhat is kiosk?arrow_forward
- If food is produced in the U.S., sold in the U.S. and consumed in the U.S., a reduction in its price will have which of the following effects ______? Two of the answers are correct. The consumer price index will decrease. None of the answers are correct. The GDP deflator will decrease.arrow_forwardhow to caculate verible cost?arrow_forwardWhat is the deficit?arrow_forward
 Microeconomics: Private and Public Choice (MindTa...EconomicsISBN:9781305506893Author:James D. Gwartney, Richard L. Stroup, Russell S. Sobel, David A. MacphersonPublisher:Cengage Learning
 Economics: Private and Public Choice (MindTap Cou...EconomicsISBN:9781305506725Author:James D. Gwartney, Richard L. Stroup, Russell S. Sobel, David A. MacphersonPublisher:Cengage Learning
 Principles of Economics (MindTap Course List)EconomicsISBN:9781305585126Author:N. Gregory MankiwPublisher:Cengage Learning
 Principles of Microeconomics (MindTap Course List)EconomicsISBN:9781305971493Author:N. Gregory MankiwPublisher:Cengage Learning
 Principles of Economics, 7th Edition (MindTap Cou...EconomicsISBN:9781285165875Author:N. Gregory MankiwPublisher:Cengage Learning
 Principles of MicroeconomicsEconomicsISBN:9781305156050Author:N. Gregory MankiwPublisher:Cengage Learning