
Videos
Evaluating division performance over time
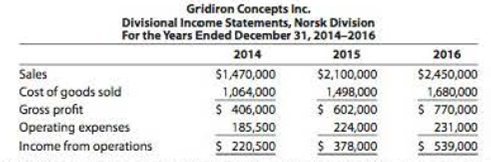
The Norsk Division of Gridiron Concepts Inc. has been experiencing revenue and profit growth during the years 2014-2016. The divisional income statements follow:
Assume that there are no charges from Service departments. The vice president of the division, Tom Yang, is proud of his division’s performance over the last three years. The president of Gridiron Concepts Inc., Anna Evans, is discussing the division’s performance with Tom, as follows:
Tom: As you can see, we’ve had a successful three years in the Norsk Division.
Anna: I’m not too sure.
Tom: What do you mean? Look at our results. Our income from operations has more than doubled, while our profit margins are improving.
Anna: I am looking at your results. However, your income statements fail to include one very important piece of information, namely, the invested assets. You have been investing a great deal of assets into the division. You had $735,000 in invested assets in 2014, $1,500,000 in 2014 and $3,500,000 in 2016.
Tom: You are right. I’ve needed the assets in order to upgrade our technologies and expand our operations. The additional assets are one reason we have been able to grow and improve our profit margins. I don’t see that this is a problem.
Anna: The problem is that we must maintain a 15%
- 1. Determine the profit margins for the Norsk Division for 2014-2016.
- 2. Compute the investment turn over for the Norsk Division for 2014-2016. Round to two decimal places.
- 3. Compute the rate of
return on investment for the Norsk Division for 2014-2016. - 4. Evaluate the division’s performance over the 2014-2016 time period. Why was Anna concerned about the performance?
(1)
Profit margin: This ratio gauges the operating profitability by quantifying the amount of income earned from business operations from the sales generated.
Formula of profit margin:
To compute: Profit margin of N Division for the years 2014 to 2016
Explanation of Solution
Determine profit margin of N Division for the year 2014.
Determine profit margin of N Division for the year 2015.
Determine profit margin of N Division for the year 2016.
(2)
Investment turnover: This ratio gauges the operating efficiency by quantifying the amount of sales generated from the assets invested.
Formula of investment turnover:
To compute: Investment turnover of N Division for the years 2014 to 2016.
Explanation of Solution
Determine investment turnover of N Division for the year 2014.
Determine investment turnover of N Division for the year 2015.
Determine investment turnover of N Division for the year 2016.
(3)
Return on investment (ROI): This financial ratio evaluates how efficiently the assets are used in earning income from operations. So, ROI is a tool used to measure and compare the performance of a units or divisions or a companies.
Formula of ROI:
To compute: Return on investment (ROI) of N Division for the years 2014 to 2016
Explanation of Solution
Determine ROI of N Division for the year 2014.
Determine ROI of N Division for the year 2015.
Determine ROI of N Division for the year 2016.
(4)
To evaluate: Division N’s performance
Explanation of Solution
Evaluation of N Division’s performance:
By observing the operating results of N Division, the gross profit, income from operations, and revenues, it can be concluded that the performance of the division has increased considerably from 2014 to 2016. To know the actual performance, RPOI is computed in an extended form by using the profit margin, investment turnover as follows:
For 2014:
For 2015:
For 2016:
These computations show that the profitability of the division deteriorated from 2014 to 2016, due to the drop in investment turnover. So, the investments could not earn the required income, leading to decreased ROI. The assets invested were unable to earn the enough revenue.
This is a decreasing trend in the division’s performance.
Want to see more full solutions like this?
Chapter 23 Solutions
Working Papers, Volume 1, Chapters 1-15 for Warren/Reeve/Duchac's Corporate Financial Accounting, 13th + Financial & Managerial Accounting, 13th


- Please explain the correct approach for solving this financial accounting question.arrow_forwardI am looking for help with this general accounting question using proper accounting standards.arrow_forwardCan you solve this general accounting question with accurate accounting calculations?arrow_forward
 Cornerstones of Cost Management (Cornerstones Ser...AccountingISBN:9781305970663Author:Don R. Hansen, Maryanne M. MowenPublisher:Cengage Learning
 Managerial AccountingAccountingISBN:9781337912020Author:Carl Warren, Ph.d. Cma William B. TaylerPublisher:South-Western College Pub
 Financial And Managerial AccountingAccountingISBN:9781337902663Author:WARREN, Carl S.Publisher:Cengage Learning,