
(a)
Interpretation:
The Ca2+ concentration in the inner solution of electrode 2 should be determined.
Concept introduction:
Nernst equation gives the cell potential under non-standard conditions.
E − cell potential
E0 − standard cell potential
R − universal gas constant
T − temperature in Kelvin
n − number of electrons transferred
F − Faraday constant
Q − Reaction quotient
Answer to Problem 23.27QAP
Explanation of Solution
The given reactions are represented as follows:
The equilibrium constant can be calculated as follows:
Here,
If x mol/L of Ca-EDTA complex is dissociated.
(b)
Interpretation:
The ionic strength of the solution in Electrode 2 should be determined.
Concept introduction:
The ionic strength can be calculated as follows:
Here,
µ − ionic strength
c − molar concentrations of the ions
Z − charge on the ion.
Answer to Problem 23.27QAP
Explanation of Solution
On putting the respective molar concentrations of ions and charge on the ion, the ionic strength can be calculated as follows:
(c)
Interpretation:
The activity of Ca2+ in electrode 2 should be determined.
Concept introduction:
The activity of coefficient of species A can be calculated as follows:
Here,
Answer to Problem 23.27QAP
Explanation of Solution
The activity of coefficient of species A can be calculated as follows:
Also,
(d)
Interpretation:
The cell potential versus the pCa should be plotted and pCa value where the plot deviated more than 5% from linearity should be determined. For the linear portion, the slope and the intercept should be determined.
Concept introduction:
For cations,
Here,
K − constant
n − number of moles of electrons
X − activity of the cation.
Answer to Problem 23.27QAP
At
Slope = -0.0298
Intercept =0.185733
The plot obeys the equation 23-29.
Explanation of Solution
The data given is as follows:
| Activity of Ca2+, M | pCa | Cell potential, V |
| 1.00E-03 | 3 | 9.30E-02 |
| 1.00E-04 | 4 | 7.30E-02 |
| 1.00E-05 | 5 | 3.70E-02 |
| 1.00E-06 | 6 | 2.00E-03 |
| 1.00E-07 | 7 | -2.30E-02 |
| 1.00E-08 | 8 | -5.10E-02 |
| 1.00E-09 | 9 | 5.50E-02 |
The plot is represented as follows:
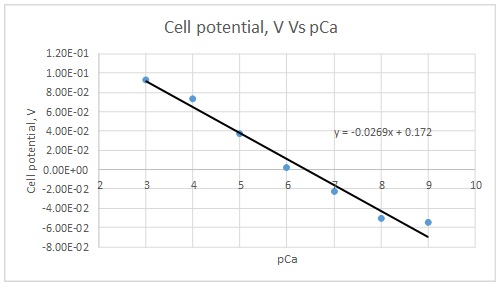
At
Let’s draw the graph eliminating this value.
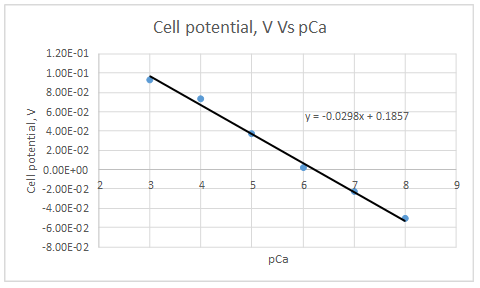
According to the linear regression analysis done in a spread sheet,
Slope = -0.0298
Intercept =0.185733
According to the equation 23.29,
Therefore, the plot obeys the equation 23-29.
(e)
Interpretation:
The cell potential versus the pCa should be plotted for electrode 2 and the range of linearity should be determined. For the linear portion, the slope and the intercept should be determined.
Concept introduction:
For cations,
Here,
K − constant
n − number of moles of electrons
X − activity of the cation.
Answer to Problem 23.27QAP
Range of linearity is from pCa 3 to 6
Slope = -0.0292
Intercept = 0.3119
This electrode obeys the equation 23-29 for higher Ca2+ activities
Explanation of Solution
The data given is as follows:
| Activity of Ca2+, M | pCa | Cell potential, V |
| 1.00E-03 | 3 | 2.28E-01 |
| 1.00E-04 | 4 | 1.90E-01 |
| 1.00E-05 | 5 | 1.65E-01 |
| 1.00E-06 | 6 | 1.39E-01 |
| 5.60E-07 | 6.25181197 | 1.05E-01 |
| 3.20E-07 | 6.49485002 | 6.30E-02 |
| 1.80E-07 | 6.74472749 | 3.60E-02 |
| 1.00E-07 | 7 | 2.30E-02 |
| 1.00E-08 | 8 | 1.80E-02 |
| 1.00E-09 | 9 | 1.70E-02 |
The graph is plotted as follows:
Range of linearity is from pCa 3 to 6
Let’s draw the graph eliminating non-linear values.
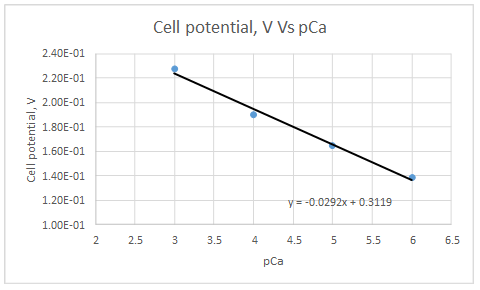
According to the linear regression analysis done in a spread sheet,
Slope = -0.0292
Intercept = 0.3119
This electrode obeys the equation 23-29 for higher Ca2+ activities.
(f)
Interpretation:
The reason for the term super-Nernstianto be used for electrode 2 should be discussed.
Concept introduction:
Electrode 2 has an inner solution with low activities of Ca2+.
Answer to Problem 23.27QAP
A super-Nernstian response is a result of an inward flux of ions which are to be analyzed.
Explanation of Solution
As a result of a super-Nernstian response, an inward flux of ions, Ca2+ in this case needed to be analyzed into the ion-selective membrane. In the diffusion layer, it decreases Ca2+ ions at the sample-membrane phase boundary. When there is low Ca2+ ions concentration, this super-Nernstian behavior usually takes place. It is usually experienced at concentrations at or below 1 × 10⁻⁶ M.
(g)
Interpretation:
The cell potential versus the pCa should be plotted and the range of linearity should be determined. For the linear portion, the slope and the intercept should be determined.
Concept introduction:
For cations,
Here,
K − constant
n − number of moles of electrons
X − activity of the cation.
Answer to Problem 23.27QAP
Range of linearity is between pCa 3 to 6
Slope = -0.0288
Intercept = 0.2636
The plot obeys the equation 23-29 at higher concentrations.
Explanation of Solution
| Activity of Ca2+, M | pCa | Cell potential, V |
| 1.00E-03 | 3 | 1.75E-01 |
| 1.00E-04 | 4 | 1.50E-01 |
| 1.00E-05 | 5 | 1.23E-01 |
| 1.00E-06 | 6 | 8.80E-02 |
| 1.00E-07 | 7 | 7.50E-02 |
| 1.00E-08 | 8 | 7.20E-02 |
| 1.00E-09 | 9 | 7.10E-02 |
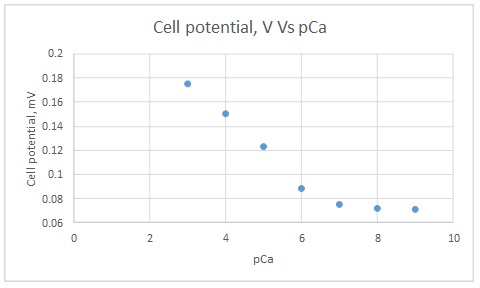
Range of linearity is between pCa 3 to 6.
Let’s draw the graph eliminating non-linear values.
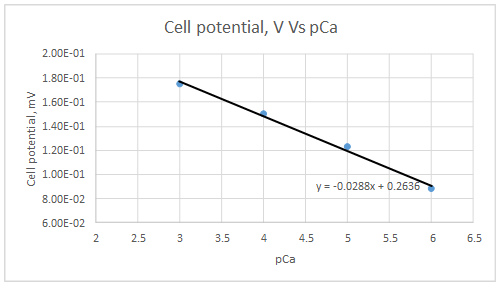
According to the linear regression analysis done in a spread sheet,
Slope = -0.0288
Intercept = 0.2636
According to the equation 23.29,
Therefore, the plot obeys the equation 23-29 at higher concentrations.
(h)
Interpretation:
Electrode 3 is said to have Ca2+ release. This term should be explained.
Concept introduction:
Electrode 3 has an inner solution with higher activities of Ca2+.
Answer to Problem 23.27QAP
When the concentration of Ca2+ in the solution is too low than that of inner solution of the electrode, Ca2+ flux outward to the solution through diffusion.
Explanation of Solution
Ca2+ is a result of an outward flux of ions which are to be analyzed, in this case Ca2+ ions out of the ion-selective membrane. This results in increase of Ca2+ ions in the diffusion layer at the sample-membrane phase boundary. This Ca2+ release usually happens when there is a low concentration of Ca2+ ions in the solution to be analyzed.
(i)
Interpretation:
The alternative explanations for experimental results given in the article should be described.
Concept introduction:
An
Answer to Problem 23.27QAP
The reason for super-Nernstian response is that at low sample activities, the gradient required to maintain the membrane flux is no more negligible relative to the bulk. Ca2+ uptake is a result of the strong coextraction of Ca(NO3)2 into the membrane.
Explanation of Solution
The emf observed with ISE are a logarithmic function of the bulk sample activities. Deviation from this behavior can be explained either by activity change in the organic membrane surface layer or by differences between sample activities in the bulk and the membrane surface layer. Deviation are a result of ions release from or uptake to the membrane. These ion fluxes originate from concentration polarization within the membrane, asymmetrical ion exchange and coextraction reactions at both membrane sides.
The reason for super-Nernstian response is that at low sample activities, the gradient required to maintain the membrane flux is no more negligible relative to the bulk. Ca2+ uptake is a result of the strong coextraction of Ca(NO3)2 into the membrane.
Want to see more full solutions like this?
Chapter 23 Solutions
Principles of Instrumental Analysis

- What is the missing reactant R in this organic reaction? ་ ་ ་ ་ ་ ་ ་ ་ ་ ་ +R H3O+ • Draw the structure of R in the drawing area below. N • Be sure to use wedge and dash bonds if it's necessary to draw one particular enantiomer. Click and drag to start drawing a structure.arrow_forwardWrite the systematic name of each organic molecule: H structure H OH OH H OH name ☐ OHarrow_forwardDetermine whether each of the following molecules is a hemiacetal, acetal, or neither and select the appropriate box in the table. CH3O OH OH OH hemiacetal acetal neither hemiacetal acetal neither Xarrow_forward
- What is the missing reactant R in this organic reaction? N N དལ་ད་་ + R • Draw the structure of R in the drawing area below. • Be sure to use wedge and dash bonds if it's necessary to draw one particular enantiomer. Click and drag to start drawing a structure. ㄖˋarrow_forwardDraw the condensed structure of 4-hydroxy-3-methylbutanal. Click anywhere to draw the first atom of your structure.arrow_forwardUsing the bond energy values, calculate the energy that must be supplied or is released upon the polymerization of 755 monomers. If energy must be supplied, provide a positive number; if energy is released, provide a negative number. Hint: Avogadro’s number is 6.02 × 1023.arrow_forward
- -AG|F=2E|V 3. Before proceeding with this problem you may want to glance at p. 466 of your textbook where various oxo-phosphorus derivatives and their oxidation states are summarized. Shown below are Latimer diagrams for phosphorus at pH values at 0 and 14: Acidic solution -0.93 +0.38 -0.51 -0.06 H3PO4 →H4P206 H3PO3 H3PO2 → P→ PH3 -0.28 -0.50 → -0.50 Basic solution 3-1.12 -1.57 -2.05 -0.89 PO HPO →→H2PO2 P PH3 -1.73 a) Under acidic conditions, H3PO4 can be reduced into H3PO3 directly (-0.28V), or via the formation and reduction of H4P2O6 (-0.93/+0.38V). Calculate the values of AG's for both processes; comment. (3 points) 0.5 PH, 0.0 -0.5- 2 3 9 3 -1.5 -2.0 Pa H,PO H,PO H,PO -3 -1 0 2 4 Oxidation state, N 2 b) Frost diagram for phosphorus under acidic conditions is shown. Identify possible disproportionation and comproportionation processes; write out chemical equations describing them. (2 points) c) Elemental phosphorus tends to disproportionate under basic conditions. Use data in…arrow_forwardThese two reactions appear to start with the same starting materials but result in different products. How do the chemicals know which product to form? Are both products formed, or is there some information missing that will direct them a particular way?arrow_forwardWhat would be the best choices for the missing reagents 1 and 3 in this synthesis? 1. PPh3 3 1 2 2. n-BuLi • Draw the missing reagents in the drawing area below. You can draw them in any arrangement you like. • Do not draw the missing reagent 2. If you draw 1 correctly, we'll know what it is. • Note: if one of your reagents needs to contain a halogen, use bromine. Explanation Check Click and drag to start drawing a structure. 2025 McGraw Hill LLC. All Rights Reserved. Terms of Use | Priva ×arrow_forward
- Predict the products of this organic reaction: Explanation Check IN NaBH3CN H+ ? Click and drag to start drawing a structure. D 5 C +arrow_forwardPredict the products of this organic reaction: H3O+ + ? • Draw all the reasonable products in the drawing area below. If there are no products, because no reaction will occur, check the box under the drawing area. • Include both major and minor products, if some of the products will be more common than others. • Be sure to use wedge and dash bonds if you need to distinguish between enantiomers. No reaction. Click and drag to start drawing a structure. dmarrow_forwardIarrow_forward
 Principles of Instrumental AnalysisChemistryISBN:9781305577213Author:Douglas A. Skoog, F. James Holler, Stanley R. CrouchPublisher:Cengage Learning
 General Chemistry - Standalone book (MindTap Cour...ChemistryISBN:9781305580343Author:Steven D. Gammon, Ebbing, Darrell Ebbing, Steven D., Darrell; Gammon, Darrell Ebbing; Steven D. Gammon, Darrell D.; Gammon, Ebbing; Steven D. Gammon; DarrellPublisher:Cengage Learning