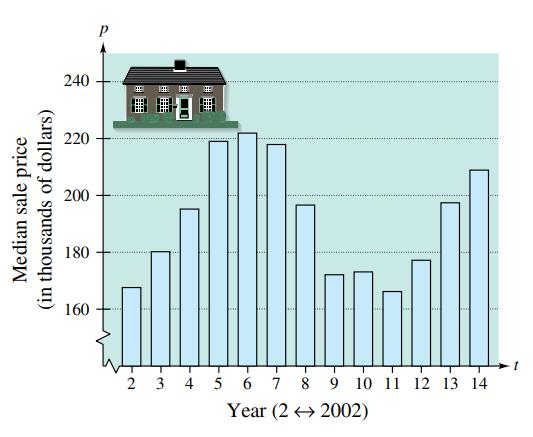
Median Sale Price The median sale price p (in thousands of dollars) of an existing one-family home in the United States from 2002 through 2014 (see figure) can be approximated by the model p t = 0.757 t 2 + 20.80 t + 127.2 , 2 ≤ t ≤ 6 3.879 t 2 + 82.50 t + 605.8 , 7 ≤ t ≤ 11 − 4.171 t 2 + 124.34 t − 714.2 , 12 ≤ t ≤ 14 where t represents the year, with t = 2 corresponding to 2002 . Use this model to find the median sale price of an existing one-family home in each year from 2002 through 2014 .
Median Sale Price The median sale price p (in thousands of dollars) of an existing one-family home in the United States from 2002 through 2014 (see figure) can be approximated by the model p t = 0.757 t 2 + 20.80 t + 127.2 , 2 ≤ t ≤ 6 3.879 t 2 + 82.50 t + 605.8 , 7 ≤ t ≤ 11 − 4.171 t 2 + 124.34 t − 714.2 , 12 ≤ t ≤ 14 where t represents the year, with t = 2 corresponding to 2002 . Use this model to find the median sale price of an existing one-family home in each year from 2002 through 2014 .
Solution Summary: The author explains the median sale price of an existing one-family home in the United States from 2002 through 2014, which is given by p(t)= left
Median Sale Price The median sale price p (in thousands of dollars) of an existing one-family home in the United States from
2002
through
2014
(see figure) can be approximated by the model
p
t
=
0.757
t
2
+
20.80
t
+
127.2
,
2
≤
t
≤
6
3.879
t
2
+
82.50
t
+
605.8
,
7
≤
t
≤
11
−
4.171
t
2
+
124.34
t
−
714.2
,
12
≤
t
≤
14
where
t
represents the year, with
t
=
2
corresponding to
2002
. Use this model to find the median sale price of an existing one-family home in each year from
2002
through
2014
.
Evaluate the following expression and show your work to support your calculations.
a). 6!
b).
4!
3!0!
7!
c).
5!2!
d). 5!2!
e).
n!
(n - 1)!
Amy and Samiha have a hat that contains two playing cards, one ace and one king. They are playing a game where they randomly pick a card out of the hat four times, with replacement.
Amy thinks that the probability of getting exactly two aces in four picks is equal to the probability of not getting exactly two aces in four picks. Samiha disagrees. She thinks that the probability of not getting exactly two aces is greater.
The sample space of possible outcomes is listed below. A represents an ace, and K represents a king. Who is correct?
Consider the exponential function f(x) = 12x. Complete the sentences about the key features of the graph.
The domain is all real numbers.
The range is y> 0.
The equation of the asymptote is y = 0
The y-intercept is 1
Chapter 2 Solutions
College Algebra Real Mathematics Real People Edition 7
Need a deep-dive on the concept behind this application? Look no further. Learn more about this topic, algebra and related others by exploring similar questions and additional content below.
Hypothesis Testing using Confidence Interval Approach; Author: BUM2413 Applied Statistics UMP;https://www.youtube.com/watch?v=Hq1l3e9pLyY;License: Standard YouTube License, CC-BY
Hypothesis Testing - Difference of Two Means - Student's -Distribution & Normal Distribution; Author: The Organic Chemistry Tutor;https://www.youtube.com/watch?v=UcZwyzwWU7o;License: Standard Youtube License


 College AlgebraAlgebraISBN:9781305115545Author:James Stewart, Lothar Redlin, Saleem WatsonPublisher:Cengage Learning
 Algebra & Trigonometry with Analytic GeometryAlgebraISBN:9781133382119Author:SwokowskiPublisher:Cengage
 Glencoe Algebra 1, Student Edition, 9780079039897...AlgebraISBN:9780079039897Author:CarterPublisher:McGraw Hill
 Trigonometry (MindTap Course List)TrigonometryISBN:9781337278461Author:Ron LarsonPublisher:Cengage Learning
 Big Ideas Math A Bridge To Success Algebra 1: Stu...AlgebraISBN:9781680331141Author:HOUGHTON MIFFLIN HARCOURTPublisher:Houghton Mifflin Harcourt