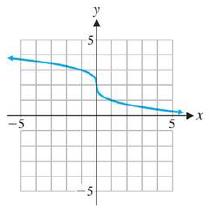
Each graph in Problems 35 - 42 is the result of applying sequence of transformations to the graph of one of the six basic functions in Figure 1 on page 58 . Identify the basic function and describe the transformation verbally. Write an equation for the given graph.
Each graph in Problems 35 - 42 is the result of applying sequence of transformations to the graph of one of the six basic functions in Figure 1 on page 58 . Identify the basic function and describe the transformation verbally. Write an equation for the given graph.
Solution Summary: The author explains the basic function and the resultant function. The graph of the six basic functions is obtained by taking a reflection of basic cube root function p(x)=sqrt
Each graph in Problems
35
-
42
is the result of applying sequence of transformations to the graph of one of the six basic functions in Figure
1
on page
58
. Identify the basic function and describe the transformation verbally. Write an equation for the given graph.
Find a basis and dimension for the null space of the following matrix:
3 -2 0 7
-2
1-1 1
5 3 19-2
8
06
1
-2 -4
-5-6
-9
4-6
11
6
Find a basis and dimension for the column space of the same matrix (above).
3. (i) Below is the R code for performing a X2 test on a 2×3 matrix of categorical
variables called TestMatrix:
chisq.test(Test Matrix)
(a) Assuming we have a significant result for this procedure, provide the R
code (including any required packages) for an appropriate post hoc test.
(b) If we were to apply this technique to a 2 × 2 case, how would we adapt
the code in order to perform the correct test?
(ii) What procedure can we use if we want to test for association when we
have ordinal variables? What code do we use in R to do this? What package
does this command belong to?
(iii) The following code contains the initial steps for a scenario where we are
looking to investigate the relationship between age and whether someone owns
a car by using frequencies. There are two issues with the code - please state
these.
Row3<-c(75,15)
Row4<-c(50,-10)
MortgageMatrix<-matrix(c(Row1, Row4), byrow=T, nrow=2,
MortgageMatrix
dimnames=list(c("Yes", "No"), c("40 or older","<40")))…
Describe the situation in which Fisher’s exact test would be used?(ii) When do we use Yates’ continuity correction (with respect to contingencytables)?[2 Marks] 2. Investigate, checking the relevant assumptions, whether there is an associationbetween age group and home ownership based on the sample dataset for atown below:Home Owner: Yes NoUnder 40 39 12140 and over 181 59Calculate and evaluate the effect size.
Chapter 2 Solutions
Finite Mathematics for Business, Economics, Life Sciences and Social Sciences Plus NEW MyLab Math with Pearson eText -- Access Card Package (13th Edition)
Need a deep-dive on the concept behind this application? Look no further. Learn more about this topic, subject and related others by exploring similar questions and additional content below.
Linear Equation | Solving Linear Equations | What is Linear Equation in one variable ?; Author: Najam Academy;https://www.youtube.com/watch?v=tHm3X_Ta_iE;License: Standard YouTube License, CC-BY


 Algebra for College StudentsAlgebraISBN:9781285195780Author:Jerome E. Kaufmann, Karen L. SchwittersPublisher:Cengage Learning
 Intermediate AlgebraAlgebraISBN:9781285195728Author:Jerome E. Kaufmann, Karen L. SchwittersPublisher:Cengage Learning
 Algebra: Structure And Method, Book 1AlgebraISBN:9780395977224Author:Richard G. Brown, Mary P. Dolciani, Robert H. Sorgenfrey, William L. ColePublisher:McDougal Littell
 Glencoe Algebra 1, Student Edition, 9780079039897...AlgebraISBN:9780079039897Author:CarterPublisher:McGraw Hill