
Concept explainers
Videos
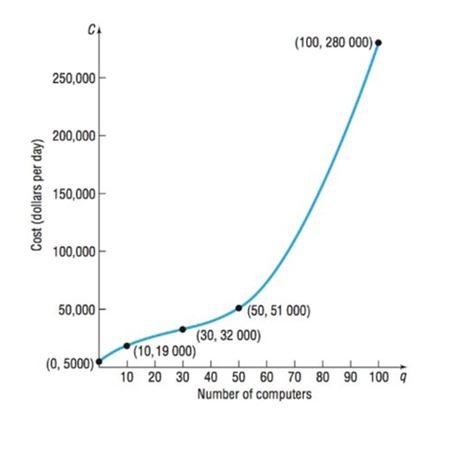
Reading and Interpreting Graphs Let be the function whose graph is given in the next column. This graph represents the cost of manufacturing computers in a day.
(a) Determine . Interpret this value.
(b) Determine . Interpret this value.
(c) Determine . Interpret this value.
(d) What is the domain of ? What does this domain imply in terms of daily production?
(e) Describe the shape of the graph.
(f) The point is called an inflection point. Describe the behavior of the graph around the inflection point.
Want to see the full answer?
Check out a sample textbook solution
Chapter 2 Solutions
Precalculus
Additional Math Textbook Solutions
Math in Our World
Elementary Statistics: A Step By Step Approach
A Problem Solving Approach To Mathematics For Elementary School Teachers (13th Edition)
Graphical Approach To College Algebra
Elementary Statistics
A First Course in Probability (10th Edition)


- Suppose that a particle moves along a straight line with velocity v (t) = 62t, where 0 < t <3 (v(t) in meters per second, t in seconds). Find the displacement d (t) at time t and the displacement up to t = 3. d(t) ds = ["v (s) da = { The displacement up to t = 3 is d(3)- meters.arrow_forwardLet f (x) = x², a 3, and b = = 4. Answer exactly. a. Find the average value fave of f between a and b. fave b. Find a point c where f (c) = fave. Enter only one of the possible values for c. c=arrow_forwardplease do Q3arrow_forward
- Use the properties of logarithms, given that In(2) = 0.6931 and In(3) = 1.0986, to approximate the logarithm. Use a calculator to confirm your approximations. (Round your answers to four decimal places.) (a) In(0.75) (b) In(24) (c) In(18) 1 (d) In ≈ 2 72arrow_forwardFind the indefinite integral. (Remember the constant of integration.) √tan(8x) tan(8x) sec²(8x) dxarrow_forwardFind the indefinite integral by making a change of variables. (Remember the constant of integration.) √(x+4) 4)√6-x dxarrow_forward
- a -> f(x) = f(x) = [x] show that whether f is continuous function or not(by using theorem) Muslim_mathsarrow_forwardUse Green's Theorem to evaluate F. dr, where F = (√+4y, 2x + √√) and C consists of the arc of the curve y = 4x - x² from (0,0) to (4,0) and the line segment from (4,0) to (0,0).arrow_forwardEvaluate F. dr where F(x, y, z) = (2yz cos(xyz), 2xzcos(xyz), 2xy cos(xyz)) and C is the line π 1 1 segment starting at the point (8, ' and ending at the point (3, 2 3'6arrow_forward
 Intermediate AlgebraAlgebraISBN:9781285195728Author:Jerome E. Kaufmann, Karen L. SchwittersPublisher:Cengage Learning
 Functions and Change: A Modeling Approach to Coll...AlgebraISBN:9781337111348Author:Bruce Crauder, Benny Evans, Alan NoellPublisher:Cengage Learning

 Big Ideas Math A Bridge To Success Algebra 1: Stu...AlgebraISBN:9781680331141Author:HOUGHTON MIFFLIN HARCOURTPublisher:Houghton Mifflin Harcourt