To determine: The percent change in production of goods in given periods of time.
Concept Introduction:
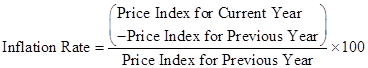
Inflation rate: The overall increase in
Formula to calculate inflation rate is:
Explanation of Solution
a. Percentage change in production.
Percentage change in the production of computer:
| Year | Quantity of Computer(B) | Total Production($)(C) | Old Production($)(D) | Change in Production($)(E) | Percentage Change in Production(%) | |
| 2012 | 900 | 10 | 9,000 | - | - | - |
| 2013 | 1,000 | 10.5 | 10,500 | 9,000 | 1,500 | 16.7 |
| 2014 | 1,050 | 12 | 1,2600 | 10,500 | 2,100 | 20 |
Percentage change in production of DVDs:
| Year | Price of DVDs($)(A) | Quantity of DVDs(B) | Total Production($)(C) | Old Production($)(D) | Change in Production($)(E) | Percentage Change in Production(%) |
| 2012 | 10 | 100 | 1,000 | - | - | - |
| 2013 | 12 | 105 | 1,260 | 1,000 | 260 | 26 |
| 2014 | 14 | 110 | 1,540 | 1,260 | 280 | 22.2 |
Percentage change in production of pizzas:
| Year | Price of DVDs($)(A) | Quantity of DVDs(B) | Total Production($)(C) | Old Production($)(D) | Change in Production($)(E) | Percentage Change in Production(%) |
| 2012 | 15 | 2 | 30 | - | - | - |
| 2013 | 16 | 2 | 32 | 30 | 2 | 6.7 |
| 2014 | 17 | 3 | 51 | 32 | 19 | 59.4 |
Conclusion:
Thus, percentage change in the production of computer, DVDs and pizzas is calculated above.
b. Percentage change in prices.
Percentage change in price of computer:
| Year | Price of Computer($)(A) | Old Price($)(B) | Change in Price($)(C) | Percentage Change in Price(%) |
| 2012 | 900 | - | - | - |
| 2013 | 1,000 | 900 | 100 | 11.1 |
| 2014 | 1,050 | 1,000 | 50 | 5 |
Percentage change in price of DVDs:
| Year | Price of DVDs($)(A) | Old Price($)(B) | Change in Price($)(C) | Percentage Change in Price(%) |
| 2012 | 10 | - | - | |
| 2013 | 12 | 10 | 2 | 20 |
| 2014 | 14 | 12 | 2 | 16.7 |
Percentage change in price of Pizza:
| Year | Price of Pizza($)(A) | Old Price($)(B) | Change in Price($)(C) | Percentage Change in Price(%) |
| 2012 | 15 | - | - | |
| 2013 | 16 | 15 | 1 | 6.7 |
| 2014 | 17 | 16 | 1 | 6.25 |
Conclusion:
Thus, percentage change in price of computer, DVDs and pizzas is calculated above.
c. Nominal GDP.
Total production of computer, DVDs and pizzas is calculated in part a.
Nominal GDP:
| Year | Total Production of Computer($)(A) | Total Production of DVDs($)(B) | Total Production of Pizzas($)(C) | Nominal GDP($) |
| 2012 | 9,000 | 1,000 | 30 | 10,030 |
| 2013 | 10,500 | 1,260 | 32 | 11,792 |
| 2014 | 1,2600 | 1,540 | 51 | 14,191 |
Percentage change in Nominal GDP:
| Year | Nominal GDP($)(A) | Old GDP($)(B) | Change in GDP($)(C) | Percentage Change in Nominal GDP(%) |
| 2012 | 10,030 | - | - | - |
| 2013 | 11,792 | 10,030 | 1,762 | 17.6 |
| 2014 | 14,191 | 11,792 | 2,399 | 20.34 |
Conclusion:
Thus, nominal GDP and percentage change in nominal GDP is calculated above.
d. Real GDP.
Formula to calculate total production at the 2012 price is:

Real GDP:
| Year | Total Production of Computer($)(A) | Total Production of DVDs($)(B) | Total Production of Pizzas($)(C) | Real GDP($) |
| 2012 | 9,000 | 1,000 | 30 | 10,030 |
| 2013 | 9,450 | 1,050 | 30 | 10,530 |
| 2014 | 10,800 | 1,100 | 45 | 11,945 |
Percentage change in real GDP:
| Year | Real GDP($)(A) | Old GDP($)(B) | Change in GDP($)(C) | Percentage Change in Real GDP(%) |
| 2012 | 10,030 | - | - | - |
| 2013 | 10,530 | 10,030 | 500 | 4.99 |
| 2014 | 11,945 | 10,530 | 1,415 | 13.44 |
Conclusion:
Thus, real GDP and percentage change in real GDP is calculated above.
Want to see more full solutions like this?

- Critically analyse the five (5) characteristics of Ubuntu and provide examples of how they apply to the National Health Insurance (NHI) in South Africa.arrow_forwardCritically analyse the five (5) characteristics of Ubuntu and provide examples of how they apply to the National Health Insurance (NHI) in South Africa.arrow_forwardOutline the nine (9) consumer rights as specified in the Consumer Rights Act in South Africa.arrow_forward
- In what ways could you show the attractiveness of Philippines in the form of videos/campaigns to foreign investors? Cite 10 examples.arrow_forwardExplain the following terms and provide an example for each term: • Corruption • Fraud • Briberyarrow_forwardIn what ways could you show the attractiveness of a country in the form of videos/campaigns?arrow_forward

 Principles of Economics (12th Edition)EconomicsISBN:9780134078779Author:Karl E. Case, Ray C. Fair, Sharon E. OsterPublisher:PEARSON
 Engineering Economy (17th Edition)EconomicsISBN:9780134870069Author:William G. Sullivan, Elin M. Wicks, C. Patrick KoellingPublisher:PEARSON
 Principles of Economics (MindTap Course List)EconomicsISBN:9781305585126Author:N. Gregory MankiwPublisher:Cengage Learning
 Managerial Economics: A Problem Solving ApproachEconomicsISBN:9781337106665Author:Luke M. Froeb, Brian T. McCann, Michael R. Ward, Mike ShorPublisher:Cengage Learning
 Managerial Economics & Business Strategy (Mcgraw-...EconomicsISBN:9781259290619Author:Michael Baye, Jeff PrincePublisher:McGraw-Hill Education