
Concept explainers
Videos
(a)
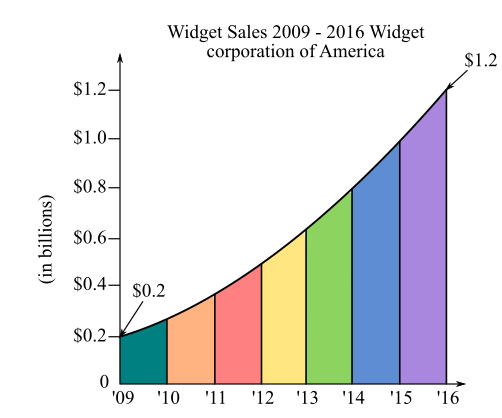
The amount of widget sales in the year
(b)
The year when widget sales reach
(c)
The representation of line graph given below,
(d)
The variables that are represented on the x-axis and y-axis of the line chart “widget sales
(e)
The amount of widget sales in the year
(f)
The year when widget sales reached
(g)
To calculate: The comparison between the widget sales of

Trending nowThis is a popular solution!

Chapter 21 Solutions
Contemporary Mathematics For Business & Consumers, Brief Edition, Loose-leaf Version


- Find the cost function if the marginal cost function is C'(x) = 3x-4 and the fixed cost is $9. C(x) = ☐arrow_forwardFor the power series ∞ (−1)" (2n+1)(x+4)” calculate Z, defined as follows: n=0 (5 - 1)√n if the interval of convergence is (a, b), then Z = sin a + sin b if the interval of convergence is (a, b), then Z = cos asin b if the interval of convergence is (a, b], then Z = sin a + cos b if the interval of convergence is [a, b], then Z = cos a + cos b Then the value of Z is -0.502 0.117 -0.144 -0.405 0.604 0.721 -0.950 -0.588arrow_forwardYou want to obtain a sample to estimate the proportion of a population that possess a particular genetic marker. Based on previous evidence, you believe approximately p∗=11% of the population have the genetic marker. You would like to be 90% confident that your estimate is within 0.5% of the true population proportion. How large of a sample size is required?n = (Wrong: 10,603) Do not round mid-calculation. However, you may use a critical value accurate to three decimal places.arrow_forward
- 2. [20] Let {X1,..., Xn} be a random sample from Ber(p), where p = (0, 1). Consider two estimators of the parameter p: 1 p=X_and_p= n+2 (x+1). For each of p and p, find the bias and MSE.arrow_forward1. [20] The joint PDF of RVs X and Y is given by xe-(z+y), r>0, y > 0, fx,y(x, y) = 0, otherwise. (a) Find P(0X≤1, 1arrow_forward4. [20] Let {X1,..., X} be a random sample from a continuous distribution with PDF f(x; 0) = { Axe 5 0, x > 0, otherwise. where > 0 is an unknown parameter. Let {x1,...,xn} be an observed sample. (a) Find the value of c in the PDF. (b) Find the likelihood function of 0. (c) Find the MLE, Ô, of 0. (d) Find the bias and MSE of 0.arrow_forward3. [20] Let {X1,..., Xn} be a random sample from a binomial distribution Bin(30, p), where p (0, 1) is unknown. Let {x1,...,xn} be an observed sample. (a) Find the likelihood function of p. (b) Find the MLE, p, of p. (c) Find the bias and MSE of p.arrow_forwardGiven the sample space: ΩΞ = {a,b,c,d,e,f} and events: {a,b,e,f} A = {a, b, c, d}, B = {c, d, e, f}, and C = {a, b, e, f} For parts a-c: determine the outcomes in each of the provided sets. Use proper set notation. a. (ACB) C (AN (BUC) C) U (AN (BUC)) AC UBC UCC b. C. d. If the outcomes in 2 are equally likely, calculate P(AN BNC).arrow_forwardH-/ test the Series 1.12 7√2 by ratio best 2n 2-12- nz by vitio test enarrow_forwardIn Exercises 1-14, state whether each statement is true or false. If false, give a reason. 1. The set of stores located in the state of Wyoming is a well- defined set. 2. The set of the three best songs is a well-defined set. 3. maple = {oak, elm, maple, sycamore} 4{} cơ 5. {3, 6, 9, 12,...} and {2, 4, 6, 8, ...} are disjoint sets. 6. {Mercury, Venus, Earth, Mars} is an example of a set in roster form. 7. {candle, picture, lamp} = {picture, chair, lamp } 8. {apple, orange, banana, pear} is equivalent to {tomato, corn, spinach, radish}.arrow_forwardConsider a single-server queueing system that can hold a maximum of two customers excluding those being served. The server serves customers only in batches of two, and the service time (for a batch) has an exponential distribution with a mean of 1 unit of time. Thus if the server is idle and there is only one customer in the system, then the server must wait for another arrival before beginning service. The customers arrive according to a Poisson process at a mean rate of 1 per unit of time. (1). Draw the rate diagram. (Hint: think about how the state will change after one service completion.) (2). Set up the rate balance equations. (Hint: use the rate balance equations 1.) (3). Compute pn and L. (4). Compute the actual mean arrival rate Ā.arrow_forwardSuppose a sample of O-rings was obtained and the wall thickness (in inches) of each was recorded. Use a normal probability plot to assess whether the sample data could have come from a population that is normally distributed. Click here to view the table of critical values for normal probability plots. Click here to view page 1 of the standard normal distribution table. Click here to view page 2 of the standard normal distribution table. 0.191 0.186 0.201 0.2005 0.203 0.210 0.234 0.248 0.260 0.273 0.281 0.290 0.305 0.310 0.308 0.311 Using the correlation coefficient of the normal probability plot, is it reasonable to conclude that the population is normally distributed? Select the correct choice below and fill in the answer boxes within your choice. (Round to three decimal places as needed.) ○ A. Yes. The correlation between the expected z-scores and the observed data, , exceeds the critical value, . Therefore, it is reasonable to conclude that the data come from a normal population. ○…arrow_forwardarrow_back_iosSEE MORE QUESTIONSarrow_forward_ios
 Algebra: Structure And Method, Book 1AlgebraISBN:9780395977224Author:Richard G. Brown, Mary P. Dolciani, Robert H. Sorgenfrey, William L. ColePublisher:McDougal Littell
 Holt Mcdougal Larson Pre-algebra: Student Edition...AlgebraISBN:9780547587776Author:HOLT MCDOUGALPublisher:HOLT MCDOUGAL