EBK STATISTICS THROUGH APPLICATIONS
2nd Edition
ISBN: 9781429293846
Author: Starnes
Publisher: MPS PUB
expand_more
expand_more
format_list_bulleted
Videos
Question
Chapter 2.1, Problem 2.6E
To determine
To construct: the bar graph on basis of given data and is it possible to make the pie chart on basis of given data.
Expert Solution & Answer
Answer to Problem 2.6E
Yes, possible
Explanation of Solution
Given:
| Game | Sales (millions of dollars) |
| Instant games | 29736 |
| Three-digit games | 5586 |
| Four-digit games | 3499 |
| Lotto | 10014 |
| Other games | 3579 |
| Total | 52414 |
Graph:
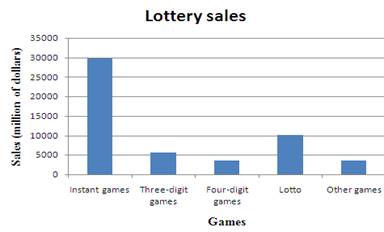
Here is given different games from where the money comes like games are instant games, three-digit games, four digit games, Lotto, other games. For each game it is possible to calculate the percentage by dividing the sales by the total sales so that it possible to make the pie chart on basis of given data.
Chapter 2 Solutions
EBK STATISTICS THROUGH APPLICATIONS
Ch. 2.1 - Prob. 2.1ECh. 2.1 - Prob. 2.2ECh. 2.1 - Prob. 2.3ECh. 2.1 - Prob. 2.4ECh. 2.1 - Prob. 2.5ECh. 2.1 - Prob. 2.6ECh. 2.1 - Prob. 2.7ECh. 2.1 - Prob. 2.8ECh. 2.1 - Prob. 2.9ECh. 2.1 - Prob. 2.10E
Ch. 2.1 - Prob. 2.11ECh. 2.1 - Prob. 2.12ECh. 2.1 - Prob. 2.13ECh. 2.1 - Prob. 2.14ECh. 2.1 - Prob. 2.15ECh. 2.1 - Prob. 2.16ECh. 2.1 - Prob. 2.17ECh. 2.1 - Prob. 2.19ECh. 2.1 - Prob. 2.20ECh. 2.1 - Prob. 2.21ECh. 2.1 - Prob. 2.23ECh. 2.1 - Prob. 2.24ECh. 2.1 - Prob. 2.25ECh. 2.1 - Prob. 2.26ECh. 2.2 - Prob. 2.27ECh. 2.2 - Prob. 2.28ECh. 2.2 - Prob. 2.29ECh. 2.2 - Prob. 2.30ECh. 2.2 - Prob. 2.31ECh. 2.2 - Prob. 2.32ECh. 2.2 - Prob. 2.33ECh. 2.2 - Prob. 2.34ECh. 2.2 - Prob. 2.35ECh. 2.2 - Prob. 2.36ECh. 2.2 - Prob. 2.37ECh. 2.2 - Prob. 2.38ECh. 2.2 - Prob. 2.39ECh. 2.2 - Prob. 2.40ECh. 2.2 - Prob. 2.41ECh. 2.2 - Prob. 2.42ECh. 2.2 - Prob. 2.43ECh. 2.2 - Prob. 2.44ECh. 2.2 - Prob. 2.45ECh. 2.2 - Prob. 2.46ECh. 2.2 - Prob. 2.47ECh. 2.2 - Prob. 2.48ECh. 2.2 - Prob. 2.49ECh. 2.2 - Prob. 2.50ECh. 2.2 - Prob. 2.51ECh. 2.2 - Prob. 2.52ECh. 2.3 - Prob. 2.53ECh. 2.3 - Prob. 2.54ECh. 2.3 - Prob. 2.55ECh. 2.3 - Prob. 2.56ECh. 2.3 - Prob. 2.57ECh. 2.3 - Prob. 2.58ECh. 2.3 - Prob. 2.59ECh. 2.3 - Prob. 2.60ECh. 2.3 - Prob. 2.61ECh. 2.3 - Prob. 2.62ECh. 2.3 - Prob. 2.63ECh. 2.3 - Prob. 2.64ECh. 2.3 - Prob. 2.65ECh. 2 - Prob. 2.67RECh. 2 - Prob. 2.68RECh. 2 - Prob. 2.69RECh. 2 - Prob. 2.70RECh. 2 - Prob. 2.71RECh. 2 - Prob. 2.72RECh. 2 - Prob. 2.73RECh. 2 - Prob. 2.74RECh. 2 - Prob. 2.75RECh. 2 - Prob. 2.76RE
Additional Math Textbook Solutions
Find more solutions based on key concepts
The measure of each angle in the triangle.
Pre-Algebra Student Edition
CHECK POINT 1 In a survey on musical tastes, respondents were asked: Do you listed to classical music? Do you l...
Thinking Mathematically (6th Edition)
Use the Substitution Formula in Theorem 7 to evaluate the integrals in Exercises 1–48.
9.
University Calculus: Early Transcendentals (4th Edition)
The null hypothesis, alternative hypothesis, test statistic, P-value and state the conclusion. To test: Whether...
Elementary Statistics
CLT Shapes (Example 4) One of the histograms is a histogram of a sample (from a population with a skewed distri...
Introductory Statistics
Derivatives Evaluate the derivatives of the following functions. 19. f(x) = cos1 (1/x)
Calculus: Early Transcendentals (2nd Edition)
Knowledge Booster


Learn more about
Need a deep-dive on the concept behind this application? Look no further. Learn more about this topic, statistics and related others by exploring similar questions and additional content below.Similar questions
- An insurer covers 200 policyholders. The probability that any policyholder will make a claim is 0.2. Let X be the number of policyholders making a claim out of the 200. Using just the cumulative distribution function (cdf), calculate P(35≤X≤55). Give your answer to 4 decimal places. NOTE: Use R Programming.arrow_forward1.34 Highly Superior Autobiographical Memory, continued. The researchers in Exercise 1.32 also administered the quiz of past public events to 30 individuals who did not claim to have any unusual memory abilities (controls). Their scores are displayed in Figure 1.17(b), using the same horizontal axis scale as that of the histogram of Figure 1.17(a) for easier comparison. a. Describe the shape, center, and spread of the distribution of quiz scores for the control individuals. b. Compare the histograms in Figure 1.17(a) and (b). How does the distribution of scores among the control individuals support your interpretation of HSAM claims from Exercise 1.32(b)? 1.32.b. This histogram suggests that the HSAM claims may be overstated. While some individuals scored very highly on the quiz, others scored only moderately well, and a significant number scored below 60%. This suggests that having HSAM does not necessarily imply perfect or near-perfect recall of autobiographical information. Some…arrow_forwardSection 10-2 Homework Assignment Section 10-2 Homework Assignment Question 4 of 8 (1 point) | Question Attempt: 1 of Unlimited www-awu.aleks.com ✓ 3 = 4 5 6 8 c A ALEKS-Mariana Quezada - Section 10-2 Ho Final grades The data show the final grades for 16 randomly selected students in College Algebra and Statistics. Find the y-value for the specified x-value. Remember that no regression should be done when r is not significant. Student 1 2 3 4 5 6 7 8 College Algebra 78 85 81 90 58 70 84 59 Statistics 80 95 62 77 68 75 80 76 Student 9 10 11 12 13 14 15 16 College Algebra 84 74 92 98 70 86 77 65 Statistics 85 57 97 99 72 77 76 72 Send data to Excel The correlation coefficient for the data is r=0.626and a=0.05 Should regression analysis be done? The regression analysis should not be done. The regression analysis should be done. Find the equation of the regression line. Round the coefficients to at least three decimal places. y'-a+bx b= Find the predicted grade in Statistics when the…arrow_forward
- Hours Watching Videos and GPA The data show a random selection of students' GPAs and the number of hours per week that they spend watching videos. Is there a linear relationship between the two variables? Student 1 2 3 4 5 6 7 8 9 10 11 12 Hours GPA 5 6 7 8 9 10 13 15 16 20 22 25 4.0 3.9 3.7 3.6 3.4 3.3 3.2 2.9 2.7 2.4 2.2 2.1 Send data to Excel Part 1 of 5 (a) Draw the scatter plot for the variables. Time Watching Videos and GPA 4 3.5- 3- 2.5 1.5- 1+ 0.5+ 0 10 15 Hours watching videos 35 Part 2 of 5 (b) Compute the value of the correlation coefficient. Round your answer to at least three decimal places. r-1.003 Part 3 of 5 (c) State the hypotheses. Hop-o Hp 0 Part: 3/5 Part 4 of 5 Skip Part Check Save For Later Español 劉 Submit Assignment 2025 McGraw Hill LLC. All Rights Reserved. Terms of Use | Privacy Center | Accessibilityarrow_forward8- Write down the definition of a "pseudo distribution function" and state (without proof) the Helly's selection theorem.arrow_forwarda.s. P 3- (a) Show that if Xn →X then Xn →X. (b) Show that if Xn r р →X then Xn- →X.arrow_forward
- In a study on speed control, it was found that the main reasons for regulations were to make traffic flow efficient and to minimize the risk of danger. An area that was focused on in the study was the distance required to completely stop a vehicle at various speeds. Use the following table to answer the questions. MPH Braking distance (yrds) 5 10 10 17 20 27 30 50 40 60 50 100 60 150 70 200 a. Suppose the correlation coefficient (r) is 0.956? Does this suggest a strong relationship? Explain b. What would you conclude about the relationship if r=0? Discuss c. Explain what Does correlation mean causation? D. Is there a relationship between the two variables? And if so, is it positive or negative? Why?arrow_forwardIn a study on speed control, it was found that the main reasons for regulations were to make traffic flow efficient and to minimize the risk of danger. An area that was focused on in the study was the distance required to completely stop a vehicle at various speeds. Use the following table to answer the questions. MPH Braking distance (yrds) 5 10 10 17 20 27 30 50 40 60 50 100 60 150 70 200arrow_forwardBusinessarrow_forward
- 3. Bayesian Inference – Updating Beliefs A medical test for a rare disease has the following characteristics: Sensitivity (true positive rate): 99% Specificity (true negative rate): 98% The disease occurs in 0.5% of the population. A patient receives a positive test result. Questions: a) Define the relevant events and use Bayes’ Theorem to compute the probability that the patient actually has the disease.b) Explain why the result might seem counterintuitive, despite the high sensitivity and specificity.c) Discuss how prior probabilities influence posterior beliefs in Bayesian inference.d) Suppose a second, independent test with the same accuracy is conducted and is also positive. Update the probability that the patient has the disease.arrow_forward4. Linear Regression - Model Assumptions and Interpretation A real estate analyst is studying how house prices (Y) are related to house size in square feet (X). A simple linear regression model is proposed: The analyst fits the model and obtains: • Ŷ50,000+150X YBoB₁X + € • R² = 0.76 • Residuals show a fan-shaped pattern when plotted against fitted values. Questions: a) Interpret the slope coefficient in context. b) Explain what the R² value tells us about the model's performance. c) Based on the residual pattern, what regression assumption is likely violated? What might be the consequence? d) Suggest at least two remedies to improve the model, based on the residual analysis.arrow_forward5. Probability Distributions – Continuous Random Variables A factory machine produces metal rods whose lengths (in cm) follow a continuous uniform distribution on the interval [98, 102]. Questions: a) Define the probability density function (PDF) of the rod length.b) Calculate the probability that a randomly selected rod is shorter than 99 cm.c) Determine the expected value and variance of rod lengths.d) If a sample of 25 rods is selected, what is the probability that their average length is between 99.5 cm and 100.5 cm? Justify your answer using the appropriate distribution.arrow_forward
arrow_back_ios
SEE MORE QUESTIONS
arrow_forward_ios
Recommended textbooks for you
 MATLAB: An Introduction with ApplicationsStatisticsISBN:9781119256830Author:Amos GilatPublisher:John Wiley & Sons Inc
 Probability and Statistics for Engineering and th...StatisticsISBN:9781305251809Author:Jay L. DevorePublisher:Cengage Learning
 Statistics for The Behavioral Sciences (MindTap C...StatisticsISBN:9781305504912Author:Frederick J Gravetter, Larry B. WallnauPublisher:Cengage Learning
 Elementary Statistics: Picturing the World (7th E...StatisticsISBN:9780134683416Author:Ron Larson, Betsy FarberPublisher:PEARSON
 The Basic Practice of StatisticsStatisticsISBN:9781319042578Author:David S. Moore, William I. Notz, Michael A. FlignerPublisher:W. H. Freeman
 Introduction to the Practice of StatisticsStatisticsISBN:9781319013387Author:David S. Moore, George P. McCabe, Bruce A. CraigPublisher:W. H. Freeman
MATLAB: An Introduction with Applications
Statistics
ISBN:9781119256830
Author:Amos Gilat
Publisher:John Wiley & Sons Inc
Probability and Statistics for Engineering and th...
Statistics
ISBN:9781305251809
Author:Jay L. Devore
Publisher:Cengage Learning
Statistics for The Behavioral Sciences (MindTap C...
Statistics
ISBN:9781305504912
Author:Frederick J Gravetter, Larry B. Wallnau
Publisher:Cengage Learning
Elementary Statistics: Picturing the World (7th E...
Statistics
ISBN:9780134683416
Author:Ron Larson, Betsy Farber
Publisher:PEARSON
The Basic Practice of Statistics
Statistics
ISBN:9781319042578
Author:David S. Moore, William I. Notz, Michael A. Fligner
Publisher:W. H. Freeman
Introduction to the Practice of Statistics
Statistics
ISBN:9781319013387
Author:David S. Moore, George P. McCabe, Bruce A. Craig
Publisher:W. H. Freeman
How to make Frequency Distribution Table / Tally Marks and Frequency Distribution Table; Author: Reenu Math;https://www.youtube.com/watch?v=i_A6RiE8tLE;License: Standard YouTube License, CC-BY
Frequency distribution table in statistics; Author: Math and Science;https://www.youtube.com/watch?v=T7KYO76DoOE;License: Standard YouTube License, CC-BY
Frequency Distribution Table for Grouped/Continuous data | Math Dot Com; Author: Maths dotcom;https://www.youtube.com/watch?v=ErnccbXQOPY;License: Standard Youtube License