
Concept explainers
Videos
(a)
To explain the shape of the given dot plot.
(a)
Answer to Problem 22E
Right skewed.
Explanation of Solution
Given:
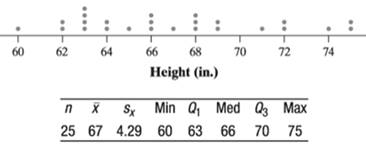
Based on the given dot plot it is clearly seen that the shape of the given distribution is positively skewed or right skewed. As it seems the tail of the distribution is towards the right side. Also the value of
(b)
To identify the mean and median of the distribution of distance.
(b)
Answer to Problem 22E
Mean = 67 inch.
Median = 66 inch.
Explanation of Solution
Based on the given statistics about the distance data, the mean is equal to 67 inch and the median is equal to 66 inch.
(c)
To identify the standard deviation and the
(c)
Answer to Problem 22E
Standard deviation = 4.29
Interquartile
Explanation of Solution
Based on the given statistics about the data the standard deviation is 4.29 inch. and the Interquartile range is the difference between the third and the first
Chapter 2 Solutions
EBK PRACTICE OF STAT.F/AP EXAM,UPDATED
Additional Math Textbook Solutions
Thinking Mathematically (6th Edition)
College Algebra (7th Edition)
College Algebra with Modeling & Visualization (5th Edition)
Calculus: Early Transcendentals (2nd Edition)
University Calculus: Early Transcendentals (4th Edition)
Elementary Statistics: Picturing the World (7th Edition)


- Please help me with this question on statisticsarrow_forwardPlease help me with this statistics questionarrow_forwardPlease help me with the following statistics questionFor question (e), the options are:Assuming that the null hypothesis is (false/true), the probability of (other populations of 150/other samples of 150/equal to/more data/greater than) will result in (stronger evidence against the null hypothesis than the current data/stronger evidence in support of the null hypothesis than the current data/rejecting the null hypothesis/failing to reject the null hypothesis) is __.arrow_forward
- Please help me with the following question on statisticsFor question (e), the drop down options are: (From this data/The census/From this population of data), one can infer that the mean/average octane rating is (less than/equal to/greater than) __. (use one decimal in your answer).arrow_forwardHelp me on the following question on statisticsarrow_forward3. [15] The joint PDF of RVS X and Y is given by fx.x(x,y) = { x) = { c(x + { c(x+y³), 0, 0≤x≤ 1,0≤ y ≤1 otherwise where c is a constant. (a) Find the value of c. (b) Find P(0 ≤ X ≤,arrow_forwardNeed help pleasearrow_forward7. [10] Suppose that Xi, i = 1,..., 5, are independent normal random variables, where X1, X2 and X3 have the same distribution N(1, 2) and X4 and X5 have the same distribution N(-1, 1). Let (a) Find V(X5 - X3). 1 = √(x1 + x2) — — (Xx3 + x4 + X5). (b) Find the distribution of Y. (c) Find Cov(X2 - X1, Y). -arrow_forward1. [10] Suppose that X ~N(-2, 4). Let Y = 3X-1. (a) Find the distribution of Y. Show your work. (b) Find P(-8< Y < 15) by using the CDF, (2), of the standard normal distribu- tion. (c) Find the 0.05th right-tail percentage point (i.e., the 0.95th quantile) of the distri- bution of Y.arrow_forward6. [10] Let X, Y and Z be random variables. Suppose that E(X) = E(Y) = 1, E(Z) = 2, V(X) = 1, V(Y) = V(Z) = 4, Cov(X,Y) = -1, Cov(X, Z) = 0.5, and Cov(Y, Z) = -2. 2 (a) Find V(XY+2Z). (b) Find Cov(-x+2Y+Z, -Y-2Z).arrow_forward1. [10] Suppose that X ~N(-2, 4). Let Y = 3X-1. (a) Find the distribution of Y. Show your work. (b) Find P(-8< Y < 15) by using the CDF, (2), of the standard normal distribu- tion. (c) Find the 0.05th right-tail percentage point (i.e., the 0.95th quantile) of the distri- bution of Y.arrow_forward== 4. [10] Let X be a RV. Suppose that E[X(X-1)] = 3 and E(X) = 2. (a) Find E[(4-2X)²]. (b) Find V(-3x+1).arrow_forwardarrow_back_iosSEE MORE QUESTIONSarrow_forward_ios
 MATLAB: An Introduction with ApplicationsStatisticsISBN:9781119256830Author:Amos GilatPublisher:John Wiley & Sons Inc
 Probability and Statistics for Engineering and th...StatisticsISBN:9781305251809Author:Jay L. DevorePublisher:Cengage Learning
 Statistics for The Behavioral Sciences (MindTap C...StatisticsISBN:9781305504912Author:Frederick J Gravetter, Larry B. WallnauPublisher:Cengage Learning
 Elementary Statistics: Picturing the World (7th E...StatisticsISBN:9780134683416Author:Ron Larson, Betsy FarberPublisher:PEARSON
 The Basic Practice of StatisticsStatisticsISBN:9781319042578Author:David S. Moore, William I. Notz, Michael A. FlignerPublisher:W. H. Freeman
 Introduction to the Practice of StatisticsStatisticsISBN:9781319013387Author:David S. Moore, George P. McCabe, Bruce A. CraigPublisher:W. H. Freeman