Concept explainers
Videos
To construct the frequency distribution of the data of Freshman
Answer to Problem 20SLCT
The frequency distribution is:
| Class-Interval | Frequency |
| 40-49 | 2 |
| 50-59 | 17 |
| 60-69 | 16 |
Explanation of Solution
Given:
The data of freshman is as follows:
| SEX | WT SEPT | WT APRIL | BMI SEPT | BMI APRIL |
| M | 72 | 59 | 22.02 | 18.14 |
| M | 97 | 86 | 19.7 | 17.44 |
| M | 74 | 69 | 24.09 | 22.43 |
| M | 93 | 88 | 26.97 | 25.57 |
| F | 68 | 64 | 21.51 | 20.1 |
| M | 59 | 55 | 18.69 | 17.4 |
| F | 64 | 60 | 24.24 | 22.88 |
| F | 56 | 53 | 21.23 | 20.23 |
| F | 70 | 68 | 30.26 | 29.24 |
| F | 58 | 56 | 21.88 | 21.02 |
| F | 50 | 47 | 17.63 | 16.89 |
| M | 71 | 69 | 24.57 | 23.85 |
| M | 67 | 66 | 20.68 | 20.15 |
| F | 56 | 55 | 20.97 | 20.36 |
| F | 70 | 68 | 27.3 | 26.73 |
| F | 61 | 60 | 23.3 | 22.88 |
| F | 53 | 52 | 19.48 | 19.24 |
| M | 92 | 92 | 24.74 | 24.69 |
| F | 57 | 58 | 20.69 | 20.79 |
| M | 67 | 67 | 20.49 | 20.6 |
| F | 58 | 58 | 21.09 | 21.24 |
| F | 49 | 50 | 18.37 | 18.53 |
| M | 68 | 68 | 22.4 | 22.61 |
| F | 69 | 69 | 28.17 | 28.43 |
| M | 87 | 88 | 23.6 | 23.81 |
| M | 81 | 82 | 26.52 | 26.78 |
| M | 60 | 61 | 18.89 | 19.27 |
| F | 52 | 53 | 19.31 | 19.75 |
| M | 70 | 71 | 20.96 | 21.32 |
| F | 63 | 64 | 21.78 | 22.22 |
| F | 56 | 57 | 19.78 | 20.23 |
| M | 68 | 69 | 22.4 | 22.82 |
| M | 68 | 69 | 22.76 | 23.19 |
| F | 54 | 56 | 20.15 | 20.69 |
| M | 80 | 82 | 22.14 | 22.57 |
| M | 64 | 66 | 20.27 | 20.76 |
| F | 57 | 59 | 22.15 | 22.93 |
| F | 63 | 65 | 23.87 | 24.67 |
| F | 54 | 56 | 18.61 | 19.34 |
| F | 56 | 58 | 21.73 | 22.58 |
| M | 54 | 56 | 18.93 | 19.72 |
| M | 73 | 75 | 25.88 | 26.72 |
| M | 77 | 79 | 28.59 | 29.53 |
| F | 63 | 66 | 21.89 | 22.79 |
| F | 51 | 54 | 18.31 | 19.28 |
| F | 59 | 62 | 19.64 | 20.63 |
| F | 65 | 68 | 23.02 | 24.1 |
| F | 53 | 56 | 20.63 | 21.91 |
| F | 62 | 65 | 22.61 | 23.81 |
| F | 55 | 58 | 22.03 | 23.42 |
| M | 74 | 77 | 20.31 | 21.34 |
| M | 74 | 78 | 20.31 | 21.36 |
| M | 64 | 68 | 19.59 | 20.77 |
| M | 64 | 68 | 21.05 | 22.31 |
| F | 57 | 61 | 23.47 | 25.11 |
| F | 64 | 68 | 22.84 | 24.29 |
| F | 60 | 64 | 19.5 | 20.9 |
| M | 64 | 68 | 18.51 | 19.83 |
| M | 66 | 71 | 21.4 | 22.97 |
| F | 52 | 57 | 17.72 | 19.42 |
| M | 71 | 77 | 22.26 | 23.87 |
| F | 55 | 60 | 21.64 | 23.81 |
| M | 65 | 71 | 22.51 | 24.45 |
| M | 75 | 82 | 23.69 | 25.8 |
| F | 42 | 49 | 15.08 | 17.74 |
| M | 74 | 82 | 22.64 | 25.33 |
| M | 94 | 105 | 36.57 | 40.86 |
Formula used:
COUNTIFS(criteria_range1, criteria1, [criteria_range2, criteria2]…)
Calculation:
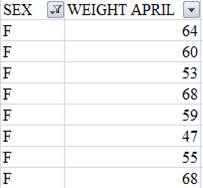
Import the data of SEX and WEIGHT APRIL from the provided data set then apply filter to the data. Data of male and female is provided.
Copy the data of male shown in screen shot:
Make the class interval starting from
| Class-Interval |
| 40-49 |
| 50-59 |
| 60-69 |
Applying the function COUNTIFS for calculating frequencies as shown below:

This is the formula for first class interval and in all the class intervals apply the same formula only values of
| Class-Interval | Frequency |
| 40-49 | 2 |
| 50-59 | 17 |
| 60-69 | 16 |
According to the above created table the data is approximately
And by looking at the data we can see that it does not appear that males gain
Want to see more full solutions like this?
Chapter 2 Solutions
EBK BIOSTATISTICS FOR THE BIOLOGICAL AN


- The accompanying data represent the weights (in grams) of a simple random sample of 10 M&M plain candies. Determine the shape of the distribution of weights of M&Ms by drawing a frequency histogram. Find the mean and median. Which measure of central tendency better describes the weight of a plain M&M? Click the icon to view the candy weight data. Draw a frequency histogram. Choose the correct graph below. ○ A. ○ C. Frequency Weight of Plain M and Ms 0.78 0.84 Frequency OONAG 0.78 B. 0.9 0.96 Weight (grams) Weight of Plain M and Ms 0.84 0.9 0.96 Weight (grams) ○ D. Candy Weights 0.85 0.79 0.85 0.89 0.94 0.86 0.91 0.86 0.87 0.87 - Frequency ☑ Frequency 67200 0.78 → Weight of Plain M and Ms 0.9 0.96 0.84 Weight (grams) Weight of Plain M and Ms 0.78 0.84 Weight (grams) 0.9 0.96 →arrow_forwardThe acidity or alkalinity of a solution is measured using pH. A pH less than 7 is acidic; a pH greater than 7 is alkaline. The accompanying data represent the pH in samples of bottled water and tap water. Complete parts (a) and (b). Click the icon to view the data table. (a) Determine the mean, median, and mode pH for each type of water. Comment on the differences between the two water types. Select the correct choice below and fill in any answer boxes in your choice. A. For tap water, the mean pH is (Round to three decimal places as needed.) B. The mean does not exist. Data table Тар 7.64 7.45 7.45 7.10 7.46 7.50 7.68 7.69 7.56 7.46 7.52 7.46 5.15 5.09 5.31 5.20 4.78 5.23 Bottled 5.52 5.31 5.13 5.31 5.21 5.24 - ☑arrow_forwardく Chapter 5-Section 1 Homework X MindTap - Cengage Learning x + C webassign.net/web/Student/Assignment-Responses/submit?pos=3&dep=36701632&tags=autosave #question3874894_3 M Gmail 品 YouTube Maps 5. [-/20 Points] DETAILS MY NOTES BBUNDERSTAT12 5.1.020. ☆ B Verify it's you Finish update: All Bookmarks PRACTICE ANOTHER A computer repair shop has two work centers. The first center examines the computer to see what is wrong, and the second center repairs the computer. Let x₁ and x2 be random variables representing the lengths of time in minutes to examine a computer (✗₁) and to repair a computer (x2). Assume x and x, are independent random variables. Long-term history has shown the following times. 01 Examine computer, x₁₁ = 29.6 minutes; σ₁ = 8.1 minutes Repair computer, X2: μ₂ = 92.5 minutes; σ2 = 14.5 minutes (a) Let W = x₁ + x2 be a random variable representing the total time to examine and repair the computer. Compute the mean, variance, and standard deviation of W. (Round your answers…arrow_forward
- The acidity or alkalinity of a solution is measured using pH. A pH less than 7 is acidic; a pH greater than 7 is alkaline. The accompanying data represent the pH in samples of bottled water and tap water. Complete parts (a) and (b). Click the icon to view the data table. (a) Determine the mean, median, and mode pH for each type of water. Comment on the differences between the two water types. Select the correct choice below and fill in any answer boxes in your choice. A. For tap water, the mean pH is (Round to three decimal places as needed.) B. The mean does not exist. Data table Тар Bottled 7.64 7.45 7.46 7.50 7.68 7.45 7.10 7.56 7.46 7.52 5.15 5.09 5.31 5.20 4.78 5.52 5.31 5.13 5.31 5.21 7.69 7.46 5.23 5.24 Print Done - ☑arrow_forwardThe median for the given set of six ordered data values is 29.5. 9 12 23 41 49 What is the missing value? The missing value is ☐.arrow_forwardFind the population mean or sample mean as indicated. Sample: 22, 18, 9, 6, 15 □ Select the correct choice below and fill in the answer box to complete your choice. O A. x= B. μεarrow_forward
- Why the correct answer is letter A? Students in an online course are each randomly assigned to receive either standard practice exercises or adaptivepractice exercises. For the adaptive practice exercises, the next question asked is determined by whether the studentgot the previous question correct. The teacher of the course wants to determine whether there is a differencebetween the two practice exercise types by comparing the proportion of students who pass the course from eachgroup. The teacher plans to test the null hypothesis that versus the alternative hypothesis , whererepresents the proportion of students who would pass the course using standard practice exercises andrepresents the proportion of students who would pass the course using adaptive practice exercises.The teacher knows that the percent confidence interval for the difference in proportion of students passing thecourse for the two practice exercise types (standard minus adaptive) is and the percent…arrow_forwardCarpetland salespersons average $8,000 per week in sales. Steve Contois, the firm's vice president, proposes a compensation plan with new selling incentives. Steve hopes that the results of a trial selling period will enable him to conclude that the compensation plan increases the average sales per salesperson. a. Develop the appropriate null and alternative hypotheses.H 0: H a:arrow_forwardتوليد تمرين شامل حول الانحدار الخطي المتعدد بطريقة المربعات الصغرىarrow_forward
- The U.S. Postal Service will ship a Priority Mail® Large Flat Rate Box (12" 3 12" 3 5½") any where in the United States for a fixed price, regardless of weight. The weights (ounces) of 20 ran domly chosen boxes are shown below. (a) Make a stem-and-leaf diagram. (b) Make a histogram. (c) Describe the shape of the distribution. Weights 72 86 28 67 64 65 45 86 31 32 39 92 90 91 84 62 80 74 63 86arrow_forward(a) What is a bimodal histogram? (b) Explain the difference between left-skewed, symmetric, and right-skewed histograms. (c) What is an outlierarrow_forward(a) Test the hypothesis. Consider the hypothesis test Ho = : against H₁o < 02. Suppose that the sample sizes aren₁ = 7 and n₂ = 13 and that $² = 22.4 and $22 = 28.2. Use α = 0.05. Ho is not ✓ rejected. 9-9 IV (b) Find a 95% confidence interval on of 102. Round your answer to two decimal places (e.g. 98.76).arrow_forward
 Big Ideas Math A Bridge To Success Algebra 1: Stu...AlgebraISBN:9781680331141Author:HOUGHTON MIFFLIN HARCOURTPublisher:Houghton Mifflin Harcourt
 Holt Mcdougal Larson Pre-algebra: Student Edition...AlgebraISBN:9780547587776Author:HOLT MCDOUGALPublisher:HOLT MCDOUGAL
 Glencoe Algebra 1, Student Edition, 9780079039897...AlgebraISBN:9780079039897Author:CarterPublisher:McGraw Hill
 Trigonometry (MindTap Course List)TrigonometryISBN:9781337278461Author:Ron LarsonPublisher:Cengage Learning