
Intro STATS, Books a la Carte Plus New Mystatlab with Pearson Etext -- Access Card Package
4th Edition
ISBN: 9780321869852
Author: Richard D. De Veaux
Publisher: PEARSON
expand_more
expand_more
format_list_bulleted
Videos
Textbook Question
Chapter 21, Problem 20E
Wind speed, part II In Exercise 18, we saw summary statistics for wind speeds at two sites near each other, both being considered as locations for an electricity-generating wind turbine. The data, recorded every 6 hours for a year, showed each of the sites had a mean wind speed high enough to qualify, but how can we tell which site is best? Here are some displays:
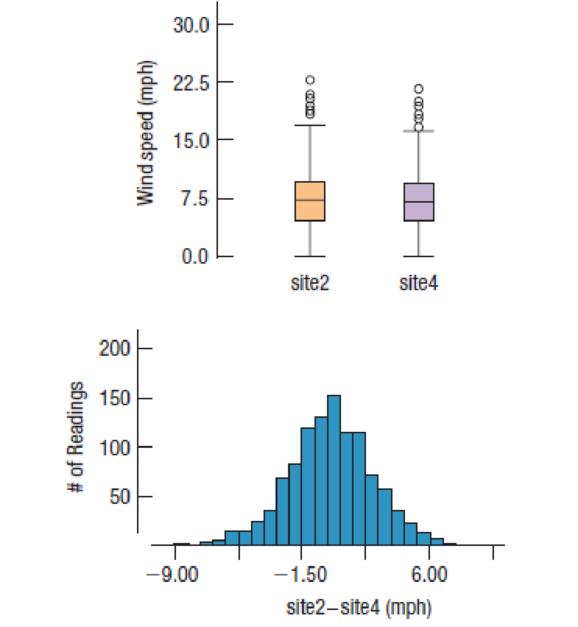
- a) The boxplots show outliers for each site, yet the histogram shows none. Discuss why.
- b) Which of the summaries would you use to select between these sites? Why?
- c) Using the information you have, discuss the assumptions and conditions for paired t inference for these data. (Hint: Think hard about the independence assumption in particular.)
Expert Solution & Answer
Want to see the full answer?
Check out a sample textbook solution
Students have asked these similar questions
A company found that the daily sales revenue of its flagship product follows a normal distribution with a mean of $4500 and a standard deviation of $450. The company defines a "high-sales day" that is, any day with sales exceeding $4800. please provide a step by step on how to get the answers in excel
Q: What percentage of days can the company expect to have "high-sales days" or sales greater than $4800?
Q: What is the sales revenue threshold for the bottom 10% of days? (please note that 10% refers to the probability/area under bell curve towards the lower tail of bell curve)
Provide answers in the yellow cells
Find the critical value for a left-tailed test using the F distribution with a 0.025, degrees of freedom in the numerator=12, and degrees of freedom in the
denominator = 50. A portion of the table of critical values of the F-distribution is provided.
Click the icon to view the partial table of critical values of the F-distribution.
What is the critical value?
(Round to two decimal places as needed.)
A retail store manager claims that the average daily sales of the store are $1,500.
You aim to test whether the actual average daily sales differ significantly from this claimed value.
You can provide your answer by inserting a text box and the answer must include:
Null hypothesis,
Alternative hypothesis,
Show answer (output table/summary table), and
Conclusion based on the P value.
Showing the calculation is a must. If calculation is missing,so please provide a step by step on the answers
Numerical answers in the yellow cells
Chapter 21 Solutions
Intro STATS, Books a la Carte Plus New Mystatlab with Pearson Etext -- Access Card Package
Ch. 21.4 - Think about each of the situations described...Ch. 21.4 - Prob. 2JCCh. 21.4 - Are parents equally strict with boys and girls? In...Ch. 21.4 - Prob. 4JCCh. 21.4 - Prob. 5JCCh. 21 - SECTION 18.1 1. Which method? Which of the...Ch. 21 - Prob. 2ECh. 21 - SECTION 18.2 3. Cars and trucks We have data on...Ch. 21 - Prob. 4ECh. 21 - Prob. 5E
Ch. 21 - Prob. 6ECh. 21 - Blocking cars and trucks Thinking about the data...Ch. 21 - Prob. 8ECh. 21 - Prob. 9ECh. 21 - Prob. 10ECh. 21 - Prob. 11ECh. 21 - Freshman 15? Many people believe that students...Ch. 21 - Prob. 13ECh. 21 - Prob. 14ECh. 21 - Prob. 15ECh. 21 - Friday the 13th, accidents The researchers in...Ch. 21 - Prob. 17ECh. 21 - Prob. 18ECh. 21 - Prob. 19ECh. 21 - Wind speed, part II In Exercise 18, we saw summary...Ch. 21 - Prob. 21ECh. 21 - Prob. 22ECh. 21 - 23. Temperatures The following table gives the...Ch. 21 - Prob. 24ECh. 21 - Prob. 25ECh. 21 - Brain waves An experiment was performed to see...Ch. 21 - Prob. 27ECh. 21 - Prob. 28ECh. 21 - Prob. 29ECh. 21 - Prob. 30ECh. 21 - Stopping distance A tire manufacturer tested the...Ch. 21 - Stopping distance 60 For another test of the tires...Ch. 21 - Prob. 33ECh. 21 - Prob. 34ECh. 21 - Prob. 35ECh. 21 - Prob. 36ECh. 21 - Prob. 37ECh. 21 - 38. Marathon start-up years 2010 When we...Ch. 21 - BST Many dairy cows now receive injections of BST,...Ch. 21 - BST II In the experiment about hormone injections...
Knowledge Booster


Learn more about
Need a deep-dive on the concept behind this application? Look no further. Learn more about this topic, statistics and related others by exploring similar questions and additional content below.Similar questions
- A marketing agency wants to determine whether different advertising platforms generate significantly different levels of customer engagement. The agency measures the average number of daily clicks on ads for three platforms: Social Media, Search Engines, and Email Campaigns. The agency collects data on daily clicks for each platform over a 10-day period and wants to test whether there is a statistically significant difference in the mean number of daily clicks among these platforms. Conduct ANOVA test. You can provide your answer by inserting a text box and the answer must include: also please provide a step by on getting the answers in excel Null hypothesis, Alternative hypothesis, Show answer (output table/summary table), and Conclusion based on the P value.arrow_forwardA company found that the daily sales revenue of its flagship product follows a normal distribution with a mean of $4500 and a standard deviation of $450. The company defines a "high-sales day" that is, any day with sales exceeding $4800. please provide a step by step on how to get the answers Q: What percentage of days can the company expect to have "high-sales days" or sales greater than $4800? Q: What is the sales revenue threshold for the bottom 10% of days? (please note that 10% refers to the probability/area under bell curve towards the lower tail of bell curve) Provide answers in the yellow cellsarrow_forwardBusiness Discussarrow_forward
arrow_back_ios
SEE MORE QUESTIONS
arrow_forward_ios
Recommended textbooks for you
 Big Ideas Math A Bridge To Success Algebra 1: Stu...AlgebraISBN:9781680331141Author:HOUGHTON MIFFLIN HARCOURTPublisher:Houghton Mifflin Harcourt
 Glencoe Algebra 1, Student Edition, 9780079039897...AlgebraISBN:9780079039897Author:CarterPublisher:McGraw Hill
 Holt Mcdougal Larson Pre-algebra: Student Edition...AlgebraISBN:9780547587776Author:HOLT MCDOUGALPublisher:HOLT MCDOUGAL
Big Ideas Math A Bridge To Success Algebra 1: Stu...
Algebra
ISBN:9781680331141
Author:HOUGHTON MIFFLIN HARCOURT
Publisher:Houghton Mifflin Harcourt
Glencoe Algebra 1, Student Edition, 9780079039897...
Algebra
ISBN:9780079039897
Author:Carter
Publisher:McGraw Hill
Holt Mcdougal Larson Pre-algebra: Student Edition...
Algebra
ISBN:9780547587776
Author:HOLT MCDOUGAL
Publisher:HOLT MCDOUGAL
Hypothesis Testing using Confidence Interval Approach; Author: BUM2413 Applied Statistics UMP;https://www.youtube.com/watch?v=Hq1l3e9pLyY;License: Standard YouTube License, CC-BY
Hypothesis Testing - Difference of Two Means - Student's -Distribution & Normal Distribution; Author: The Organic Chemistry Tutor;https://www.youtube.com/watch?v=UcZwyzwWU7o;License: Standard Youtube License