
(a):
(a):
Explanation of Solution
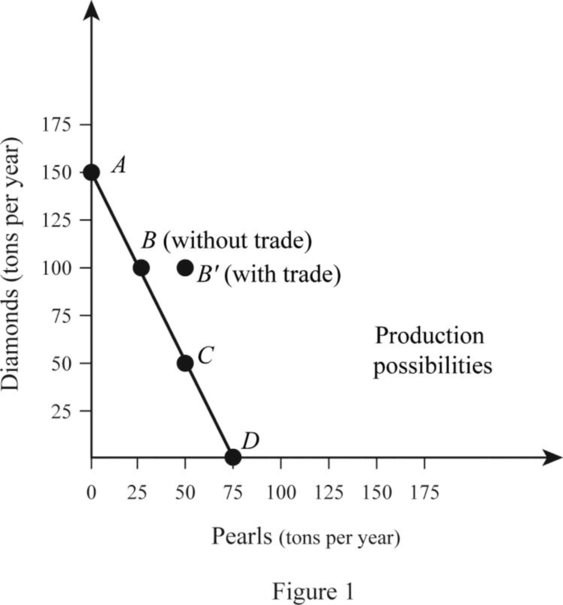
The opportunity cost of producing a commodity can be calculated by dividing the total quantity of Pearls lost with the Diamonds gained for the country. Country A produces either 150 tons of Diamonds or 75 ton of Pearls. Thus, the opportunity cost can be calculated as follows:
Therefore, the opportunity cost of producing a ton of Diamond is
Thus, the opportunity cost of producing a ton of Diamond for Country B is equal to 2 tons of Pearls.
Opportunity cost: Opportunity cost is the cost of the next best alternatives that is foregone while making the choices. When the resources are used for the production of Commodity A, Commodity B that could be made with that same quantity of resource will be the opportunity cost.
(b):
Opportunity cost of producing Pearls.
(b):
Explanation of Solution
The opportunity cost of producing Pearl can be calculated by dividing the total quantity of Diamonds lost with the Pearls gained for the country. Country A produces either 150 tons of Diamonds or 75 ton of Pearl. Thus, the opportunity cost can be calculated as follows:
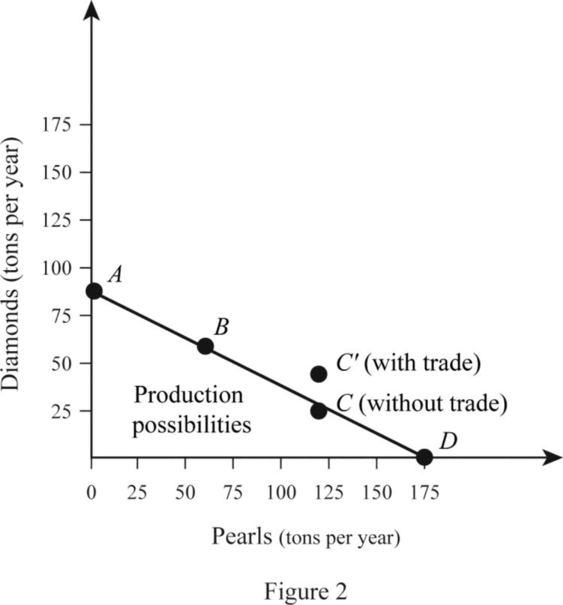
Therefore, the opportunity cost of producing a ton of Pearl is 2 tons of Pearls in Country A. Similarly, Country B can produce either 90 tons of Diamonds or 180 tons of Pearls. Thus, the opportunity cost of producing Pearl for B can be calculated as follows:
Thus, the opportunity cost of producing a ton of Pearl for Country B is equal to
(c):
Commodity in which A has a
(c):
Explanation of Solution
The
In the case of Country A, the opportunity cost of producing a ton of Diamond is
(d):
Commodity in which Country B has a comparative advantage.
(d):
Explanation of Solution
In the case of Country A, the opportunity cost of producing a ton of Diamond is
From this, it can be identified that Country B could produce Pearls at a lower opportunity cost than Country A. This indicates that Country B has comparative advantage in the production of Pearls.
(e):
Benefit of specialization.
(e):
Explanation of Solution
Country A is in its PPC Curve B where it produces 100 tons of Diamonds and 25 tons of Pearls. Country B is on its PPC curve C where it produces 30 tons of Diamonds and 120 tons of Pearls. Thus, the total output is 130 tons of Diamonds and 145 tons of Pearls. When the country specializes, Country A produces only Diamonds, which is 150 tons and B produces only Pearls, which is 180 tons. Thus, the total output increases due to specialization by 20 tons of Diamonds and 35 tons of Pearls. This can be illustrated in a table as follows:
| Diamonds (in tons per year) | Pearls (In tons per year) | |
| Before Specialization | ||
| A (PPC point at B) | 100 | 25 |
| B (PP C point at C) | 30 | 120 |
| Total Output | 130 | 145 |
| After Specialization | ||
| A (PPC point at A) | 150 | 0 |
| B (PP C point at D) | 0 | 180 |
| Total Output | 150 | 180 |
Thus, the total output of Diamonds and Pearls increases as the economy specializes in the production of commodities in which they have comparative advantages.
(f):
Graphical representation of specialization and trade benefit for the countries.
(f):
Explanation of Solution
When there is no specialization and trade between A and B, Country A operates at PPC point B where it produces and consumes 100 tons of Diamonds and 25 tons of Pearls. The case with Country B is different and it operates at Point C of the PPC where it produces and consumes 30 tons of Diamonds and 120 tons of Pearls. When the country specializes, Country A produces 150 tons of Diamonds and Country B produces 180 tons of pearls.
When the trade takes place, Country A trades 50 tons of Diamonds in exchange for 50 tons of Pearls with Country B. This means that Country A is able to consume 100 tons of Diamonds and 50 tons of Pearl whereas Country B is able to consume 50 tons of Diamonds and 130 tons of Pearls. Thus, both countries are able to achieve a consumption point beyond their PPC which can be illustrated as follows:
Want to see more full solutions like this?
Chapter 21 Solutions
Survey of Economics (MindTap Course List)

- PART II: Multipart Problems wood or solem of triflussd aidi 1. Assume that a society has a polluting industry comprising two firms, where the industry-level marginal abatement cost curve is given by: MAC = 24 - ()E and the marginal damage function is given by: MDF = 2E. What is the efficient level of emissions? b. What constant per-unit emissions tax could achieve the efficient emissions level? points) c. What is the net benefit to society of moving from the unregulated emissions level to the efficient level? In response to industry complaints about the costs of the tax, a cap-and-trade program is proposed. The marginal abatement cost curves for the two firms are given by: MAC=24-E and MAC2 = 24-2E2. d. How could a cap-and-trade program that achieves the same level of emissions as the tax be designed to reduce the costs of regulation to the two firms?arrow_forwardOnly #4 please, Use a graph please if needed to help provearrow_forwarda-carrow_forward
- For these questions, you must state "true," "false," or "uncertain" and argue your case (roughly 3 to 5 sentences). When appropriate, the use of graphs will make for stronger answers. Credit will depend entirely on the quality of your explanation. 1. If the industry facing regulation for its pollutant emissions has a lot of political capital, direct regulatory intervention will be more viable than an emissions tax to address this market failure. 2. A stated-preference method will provide a measure of the value of Komodo dragons that is more accurate than the value estimated through application of the travel cost model to visitation data for Komodo National Park in Indonesia. 3. A correlation between community demographics and the present location of polluting facilities is sufficient to claim a violation of distributive justice. olsvrc Q 4. When the damages from pollution are uncertain, a price-based mechanism is best equipped to manage the costs of the regulator's imperfect…arrow_forwardFor environmental economics, question number 2 only please-- thank you!arrow_forwardFor these questions, you must state "true," "false," or "uncertain" and argue your case (roughly 3 to 5 sentences). When appropriate, the use of graphs will make for stronger answers. Credit will depend entirely on the quality of your explanation. 1. If the industry facing regulation for its pollutant emissions has a lot of political capital, direct regulatory intervention will be more viable than an emissions tax to address this market failure. cullog iba linevoz ve bubivorearrow_forward
- Exercise 3 The production function of a firm is described by the following equation Q=10,000-3L2 where L stands for the units of labour. a) Draw a graph for this equation. Use the quantity produced in the y-axis, and the units of labour in the x-axis. b) What is the maximum production level? c) How many units of labour are needed at that point? d) Provide one reference with you answer.arrow_forwardExercise 1 Consider the market supply curve which passes through the intercept and from which the market equilibrium data is known, this is, the price and quantity of equilibrium PE=50 and QE=2000. Considering those two points, find the equation of the supply. Draw a graph of this line. Provide one reference with your answer. Exercise 2 Considering the previous supply line, determine if the following demand function corresponds to the market demand equilibrium stated above. QD=3000-2p.arrow_forwardConsider the market supply curve which passes through the intercept and from which the marketequilibrium data is known, this is, the price and quantity of equilibrium PE=50 and QE=2000.a. Considering those two points, find the equation of the supply. b. Draw a graph of this line.arrow_forward


 Exploring EconomicsEconomicsISBN:9781544336329Author:Robert L. SextonPublisher:SAGE Publications, Inc
 Economics (MindTap Course List)EconomicsISBN:9781337617383Author:Roger A. ArnoldPublisher:Cengage Learning