Concept explainers
Videos
(a)
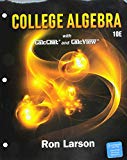
The correct graph for the situation “A person is paying $20 per week to a friend to repay a $200 loan”. Also, determine the slope and y-intercept of the graph, and interpret it in context of the situation where the given graphs are,

(b)
The correct graph for the situation “An employee receives $12.50 per hour, plus $2 for each unit produced per hour”. Also, determine the slope and y-intercept of graph, and interpret it in context of the situation.

(c)
The correct graph of the situation “A sales representative receives $30 per day for food, plus $0.32 for each mile traveled”. Also, determine the slope and y-intercept of graph, and interpret it in context of the situation.
(d)
The correct graph of the situation “A computer that was purchased for $750 depreciates $100 per year”. Also, determine the slope and y-intercept of graph, and interpret it in context of the situation.

Want to see the full answer?
Check out a sample textbook solution
Chapter 2 Solutions
Bundle: College Algebra, Loose-leaf Version, 10th + WebAssign Printed Access Card for Larson's College Algebra, 10th Edition, Single-Term


- Is 1.1 0.65 -3.4 0.23 0.4 -0.44 a basis for R3? You must explain your answer 0arrow_forwardFind the values of x and y in the following scalar multiplication. 8 2 x 1 3 || y = 9 LY_ Show Calculatorarrow_forwardA professor gives two types of quizzes, objective and recall. He plans to give at least 15 quizzes this quarter. The student preparation time for an objective quiz is 15 minutes and for a recall quiz 30 minutes. The professor would like a student to spend at least 5 hours total (300 minutes) preparing for these quizzes. It takes the professor 1 minute to grade an objective quiz, and 1.5 minutes to grade a recall type quiz. How many of each type of quiz should the professor give in order to minimize his grading time (why still meeting the other requirements outlined)?arrow_forward
- Table 15-21 shows the relative frequencies of the scores of a group of students on a philosophy quiz.Table 15-21 Score45678 Relative frequency7%11%19%24%39%arrow_forwardInstructions: Answer each question showing all work. 1. Out of 30 animals at a veterinarian clinic, 8 cats and 4 dogs have been vaccinated. 6 cats and 12 dogs are not yet vaccinated. Create a two-way frequency table to represent the data. 2. Convert the table from number 1 into a two-way relative frequency table. Instructions: Based on the tables created in questions 1 and 2 above, answer questions 3-7. 3. What percentage of cats from the total animals are vaccinated? 4. What is the relative frequency of dogs from the total animals that are not yet vaccinated? 5. What is the conditional frequency of cats that have not been vaccinated? 6. What is the marginal frequency of the total number of animals vaccinated? 7. What is the joint frequency of the cats that are vaccinated?arrow_forwardThe the high 3000arrow_forward
- How long will it take you to double your money if you invest it at a rate of 8% compounded annually?arrow_forwardOne hundred dollars is invested at 7.2% interest compounded annually. Determine how much the investment is worth after: a. I year b. 5 years c. 10 years d. 20 years e. Use your answers to parts (a)-(d) to estimate the doubling time for the investment.arrow_forward6) A farmer has 60 acres on which to plant oats or corn. Each acre of oats requires 100 lbs of fertilizer and 1 hour of labor. Each acre of corn requires 50 lbs of fertilizer and 2 hours of labor. The farmer has 5000 lbs of fertilizer and 100 hours available for labor. If the profit is $60 from each acre of oats and $100 from each acre of corn, what planting combination will produce the greatest total profit? a) Fill in the following chart to help organize the information given in the problem: Oats Labor Fertilizer Land Profit b) Write down the question of interest. Corn Available c) Define variables to answer the question of interest. Call these x and y. d) Write the objective function to answer the question of interest. e) List any constraints given in the problem.arrow_forward
- I need help with number 5.arrow_forward3) Use the following system of linear inequalities graphed below to answer the questions. a) Use the graph to write the symbolic form of the system of linear inequalities. b) Is (-4,2) a solution to the system? Explain. 5 -7 -5 -3 -2 0 2 3 4 $ 6 -2 -6 -7arrow_forward) Graph the feasible region subject to the following constraints. x + y ≤ 6 y ≤ 2x x ≥ 0, y ≥ 0 P + xarrow_forward
 Algebra and Trigonometry (MindTap Course List)AlgebraISBN:9781305071742Author:James Stewart, Lothar Redlin, Saleem WatsonPublisher:Cengage Learning
 College AlgebraAlgebraISBN:9781305115545Author:James Stewart, Lothar Redlin, Saleem WatsonPublisher:Cengage Learning
 Intermediate AlgebraAlgebraISBN:9781285195728Author:Jerome E. Kaufmann, Karen L. SchwittersPublisher:Cengage Learning
 Algebra for College StudentsAlgebraISBN:9781285195780Author:Jerome E. Kaufmann, Karen L. SchwittersPublisher:Cengage Learning