The correct graph for the situation “A person is paying $ 20 per week to a friend to repay a $ 200 loan”. Also, determine the slope and y -intercept of the graph, and interpret it in context of the situation where the given graphs are,
The correct graph for the situation “A person is paying $ 20 per week to a friend to repay a $ 200 loan”. Also, determine the slope and y -intercept of the graph, and interpret it in context of the situation where the given graphs are,
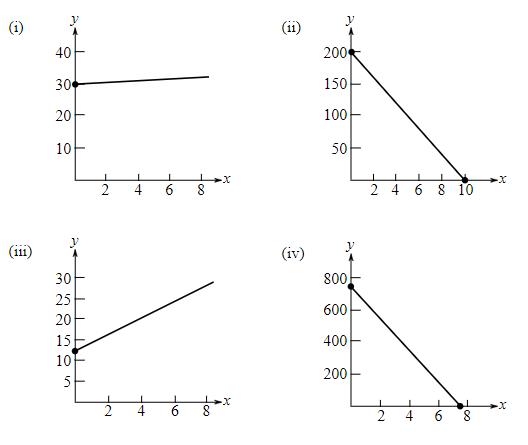
The correct graph for the situation “A person is paying $20 per week to a friend to repay a $200 loan”. Also, determine the slope and y-intercept of the graph, and interpret it in context of the situation where the given graphs are,
(b)
To determine
The correct graph for the situation “An employee receives $12.50 per hour, plus $2 for each unit produced per hour”. Also, determine the slope and y-intercept of graph, and interpret it in context of the situation.
(c)
To determine
The correct graph of the situation “A sales representative receives $30 per day for food, plus $0.32 for each mile traveled”. Also, determine the slope and y-intercept of graph, and interpret it in context of the situation.
(d)
To determine
The correct graph of the situation “A computer that was purchased for $750 depreciates $100 per year”. Also, determine the slope and y-intercept of graph, and interpret it in context of the situation.
1. Given that h(t) = -5t + 3 t². A tangent line H to the function h(t) passes through
the point (-7, B).
a. Determine the value of ẞ.
b. Derive an expression to represent the gradient of the tangent line H that is
passing through the point (-7. B).
c. Hence, derive the straight-line equation of the tangent line H
2. The function p(q) has factors of (q − 3) (2q + 5) (q) for the interval -3≤ q≤ 4.
a. Derive an expression for the function p(q).
b. Determine the stationary point(s) of the function p(q)
c. Classify the stationary point(s) from part b. above.
d. Identify the local maximum of the function p(q).
e. Identify the global minimum for the function p(q).
3. Given that m(q)
=
-3e-24-169 +9
(-39-7)(-In (30-755
a. State all the possible rules that should be used to differentiate the function
m(q). Next to the rule that has been stated, write the expression(s) of the
function m(q) for which that rule will be applied.
b. Determine the derivative of m(q)
Safari
File Edit View History
Bookmarks
Window
Help
Ο Ω
OV
O mA
0 mW
ర
Fri Apr 4 1
222
tv
A
F9
F10
DII
4
F6
F7
F8
7
29
8
00
W
E
R
T
Y
U
S
D
பட
9
O
G
H
J
K
E
F11
+ 11
F12
O
P
}
[
Need a deep-dive on the concept behind this application? Look no further. Learn more about this topic, algebra and related others by exploring similar questions and additional content below.


 Algebra and Trigonometry (MindTap Course List)AlgebraISBN:9781305071742Author:James Stewart, Lothar Redlin, Saleem WatsonPublisher:Cengage Learning
 College AlgebraAlgebraISBN:9781305115545Author:James Stewart, Lothar Redlin, Saleem WatsonPublisher:Cengage Learning
 Intermediate AlgebraAlgebraISBN:9781285195728Author:Jerome E. Kaufmann, Karen L. SchwittersPublisher:Cengage Learning
 Algebra for College StudentsAlgebraISBN:9781285195780Author:Jerome E. Kaufmann, Karen L. SchwittersPublisher:Cengage Learning