a) We can see from the table that with the increase in value of x , there is decrease in value of y , hence we can say that coefficient of correlation is negative b) Equation of least squares is y = − 3.8856 x + 9.3251 and correlation coefficient r = − 0.9996 Plot is c) Predicted value of y at x = 2.4 is 0.00034 Given information: Five points x 1 3 5 7 10 y −5.8 −2.4 −10.7 −17.8 −29.3 Formula used: Slope, m = ∑ i = 1 n ( x i − X ¯ ) ( y i − Y ¯ ) ∑ i = 1 n ( x i − X ¯ ) 2 Y axis intercept, b = Y ¯ − m X ¯ Correlation Coefficient, r = ∑ i = 1 n ( x i − X ¯ ) ( y i − Y ¯ ) ∑ i = 1 n ( x i − X ¯ ) 2 ∑ i = 1 n ( y i − Y ¯ ) 2 Where x i and y i are the i th entry of x and y ; X ¯ and Y ¯ are means of x and y Calculation: Step 1: Calculate the mean of x and y X ¯ = 1 + 3 + 5 + 7 + 10 5 = 5.2 Y ¯ = 5.8 + ( − 2.4 ) + ( − 10.7 ) + ( − 17.8 ) + ( − 29.3 ) 5 = − 10.88 Step 2: Plot the table as shown i x i y i x i − X ¯ y i − Y ¯ ( x i − X ¯ ) 2 ( x i − X ¯ ) ( y i − Y ¯ ) ( y i − Y ¯ ) 2 1 1 5.8 -4.2 16.68 17.64 -70.056 278.2224 2 3 -2.4 -2.2 8.48 4.84 -18.658 71.9104 3 5 -10.7 -0.2 0.18 0.04 -0.036 0.0324 4 7 -17.8 1.8 -6.92 3.24 -12.456 47.8864 5 10 -29.3 4.8 -18.42 23.04 -88.416 339.2964 ∑ i = 1 n ( x i − X ¯ ) 2 = 48.8 ∑ i = 1 n ( x i − X ¯ ) ( y i − Y ¯ ) = − 189.62 ∑ i = 1 n ( y i − Y ¯ ) 2 = 737.3480 Step 3: Calculate the slope m = ∑ i = 1 n ( x i − X ¯ ) ( y i − Y ¯ ) ∑ i = 1 n ( x i − X ¯ ) 2 = − 189.62 48.8 ≈ − 3.8856 Step 4: Calculate y intercept b = Y ¯ − m X ¯ = − 10.88 − ( − 3.8856 × 5.2 ) ≈ 9.3251 The slope of the line is − 3.8856 and y intercept is 9.3251 Using slope intercept form, y = m x + b ,equation is y = − 3.8856 x + 9.3251 Step 5: Draw the scatter plot Step 6: Calculate the Correlation coefficient r = ∑ i = 1 n ( x i − X ¯ ) ( y i − Y ¯ ) ∑ i = 1 n ( x i − X ¯ ) 2 ∑ i = 1 n ( y i − Y ¯ ) 2 = − 189.62 48.8 × 737.3480 ≈ − 0.9996 Step 7: Prediction for x = 2.4 ; plug x = 2.4 in y = − 3.8856 x + 9.3251 y = − 3.8856 ( 2.4 ) + 9.3251 = 0.00034
a) We can see from the table that with the increase in value of x , there is decrease in value of y , hence we can say that coefficient of correlation is negative b) Equation of least squares is y = − 3.8856 x + 9.3251 and correlation coefficient r = − 0.9996 Plot is c) Predicted value of y at x = 2.4 is 0.00034 Given information: Five points x 1 3 5 7 10 y −5.8 −2.4 −10.7 −17.8 −29.3 Formula used: Slope, m = ∑ i = 1 n ( x i − X ¯ ) ( y i − Y ¯ ) ∑ i = 1 n ( x i − X ¯ ) 2 Y axis intercept, b = Y ¯ − m X ¯ Correlation Coefficient, r = ∑ i = 1 n ( x i − X ¯ ) ( y i − Y ¯ ) ∑ i = 1 n ( x i − X ¯ ) 2 ∑ i = 1 n ( y i − Y ¯ ) 2 Where x i and y i are the i th entry of x and y ; X ¯ and Y ¯ are means of x and y Calculation: Step 1: Calculate the mean of x and y X ¯ = 1 + 3 + 5 + 7 + 10 5 = 5.2 Y ¯ = 5.8 + ( − 2.4 ) + ( − 10.7 ) + ( − 17.8 ) + ( − 29.3 ) 5 = − 10.88 Step 2: Plot the table as shown i x i y i x i − X ¯ y i − Y ¯ ( x i − X ¯ ) 2 ( x i − X ¯ ) ( y i − Y ¯ ) ( y i − Y ¯ ) 2 1 1 5.8 -4.2 16.68 17.64 -70.056 278.2224 2 3 -2.4 -2.2 8.48 4.84 -18.658 71.9104 3 5 -10.7 -0.2 0.18 0.04 -0.036 0.0324 4 7 -17.8 1.8 -6.92 3.24 -12.456 47.8864 5 10 -29.3 4.8 -18.42 23.04 -88.416 339.2964 ∑ i = 1 n ( x i − X ¯ ) 2 = 48.8 ∑ i = 1 n ( x i − X ¯ ) ( y i − Y ¯ ) = − 189.62 ∑ i = 1 n ( y i − Y ¯ ) 2 = 737.3480 Step 3: Calculate the slope m = ∑ i = 1 n ( x i − X ¯ ) ( y i − Y ¯ ) ∑ i = 1 n ( x i − X ¯ ) 2 = − 189.62 48.8 ≈ − 3.8856 Step 4: Calculate y intercept b = Y ¯ − m X ¯ = − 10.88 − ( − 3.8856 × 5.2 ) ≈ 9.3251 The slope of the line is − 3.8856 and y intercept is 9.3251 Using slope intercept form, y = m x + b ,equation is y = − 3.8856 x + 9.3251 Step 5: Draw the scatter plot Step 6: Calculate the Correlation coefficient r = ∑ i = 1 n ( x i − X ¯ ) ( y i − Y ¯ ) ∑ i = 1 n ( x i − X ¯ ) 2 ∑ i = 1 n ( y i − Y ¯ ) 2 = − 189.62 48.8 × 737.3480 ≈ − 0.9996 Step 7: Prediction for x = 2.4 ; plug x = 2.4 in y = − 3.8856 x + 9.3251 y = − 3.8856 ( 2.4 ) + 9.3251 = 0.00034
Definition Definition Statistical measure used to assess the strength and direction of relationships between two variables. Correlation coefficients range between -1 and 1. A coefficient value of 0 indicates that there is no relationship between the variables, whereas a -1 or 1 indicates that there is a perfect negative or positive correlation.
Chapter 2.1, Problem 103E
To determine
To determine:
a) We can see from the table that with the increase in value of x
, there is decrease in value of y
, hence we can say that coefficient of correlation is negative
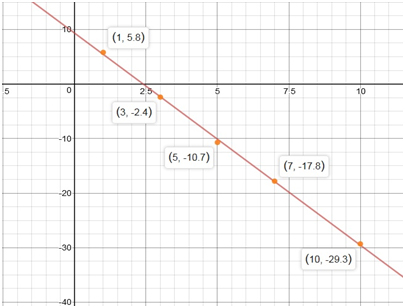
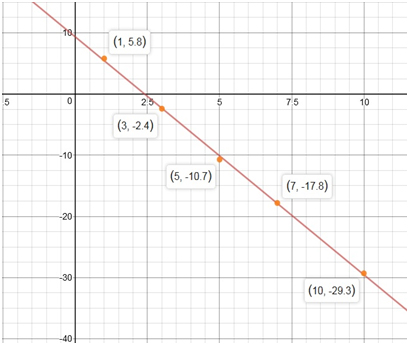
b) Equation of least squares is y=−3.8856x+9.3251
and correlation coefficientr=−0.9996
Plot is
c) Predicted value of y at x=2.4
is 0.00034
Given information: Five points
x
1
3
5
7
10
y
−5.8
−2.4
−10.7
−17.8
−29.3
Formula used:Slope, m=∑i=1n(xi−X¯)(yi−Y¯)∑i=1n(xi−X¯)2
Solve questions by Course Name (Ordinary Differential Equations II 2)
please Solve questions by Course Name( Ordinary Differential Equations II 2)
InThe Northern Lights are bright flashes of colored light between 50 and 200 miles above Earth.
Suppose a flash occurs 150 miles above Earth. What is the measure of arc BD, the portion of Earth
from which the flash is visible? (Earth’s radius is approximately 4000 miles.)
Chapter 2 Solutions
College Algebra with Modeling & Visualization (5th Edition)
Need a deep-dive on the concept behind this application? Look no further. Learn more about this topic, algebra and related others by exploring similar questions and additional content below.
Correlation Vs Regression: Difference Between them with definition & Comparison Chart; Author: Key Differences;https://www.youtube.com/watch?v=Ou2QGSJVd0U;License: Standard YouTube License, CC-BY
Correlation and Regression: Concepts with Illustrative examples; Author: LEARN & APPLY : Lean and Six Sigma;https://www.youtube.com/watch?v=xTpHD5WLuoA;License: Standard YouTube License, CC-BY


 Algebra and Trigonometry (6th Edition)AlgebraISBN:9780134463216Author:Robert F. BlitzerPublisher:PEARSON
 Contemporary Abstract AlgebraAlgebraISBN:9781305657960Author:Joseph GallianPublisher:Cengage Learning
 Linear Algebra: A Modern IntroductionAlgebraISBN:9781285463247Author:David PoolePublisher:Cengage Learning
 Algebra And Trigonometry (11th Edition)AlgebraISBN:9780135163078Author:Michael SullivanPublisher:PEARSON
 Introduction to Linear Algebra, Fifth EditionAlgebraISBN:9780980232776Author:Gilbert StrangPublisher:Wellesley-Cambridge Press
 College Algebra (Collegiate Math)AlgebraISBN:9780077836344Author:Julie Miller, Donna GerkenPublisher:McGraw-Hill Education