Intro Stats, Books a la carte Plus NEW MyLab Statistics with Pearson eText -- Access Card Package (5th Edition)
5th Edition
ISBN: 9780134210247
Author: Richard D. De Veaux, Paul Velleman, David E. Bock
Publisher: PEARSON
bartleby

Concept explainers

bartleby

Videos

Textbook Question
Book Icon
Chapter 20, Problem 6E

Shoot to score, another one Using the regression output from Exercise 2, identify the residual standard deviation and explain its meaning with a sentence in context.

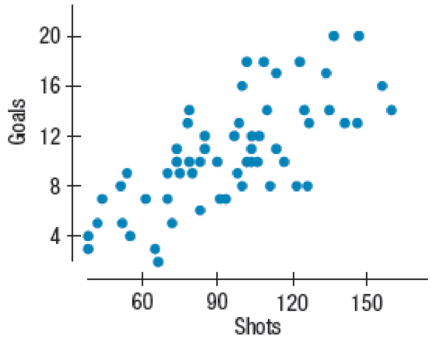
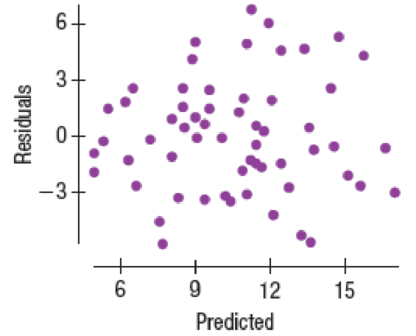
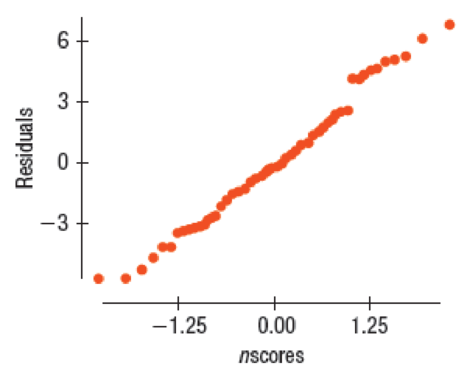
2. Shoot to score 2016 A college hockey coach collected data from the 2016–2017 National Hockey League season. He hopes to convince his players that the number of shots taken has an effect on the number of goals scored. The coach performed a preliminary analysis, using the scoring statistics from 65 offensive players who had played at least 44 games by the middle of the season. (If you use the data file, note that it includes defensive players as well. Use the variable Offense to select the players in this analysis.) He predicts Goals from number of Shots. Write the regression model and explain what the slope coefficient means in this context.

Response variable is: Goals

R squared = 49.9%

s = 2.983 with 65 – 2 = 63 degrees of freedom

Variable Coefficient SE(Coeff) t-ratio P-value
Intercept 1.13495 1.231 0.922 0.3602
Shots 0.099267 0.0125 7.93 <0.0001

Chapter 20, Problem 6E, Shoot to score, another one Using the regression output from Exercise 2, identify the residual , example  1

Chapter 20, Problem 6E, Shoot to score, another one Using the regression output from Exercise 2, identify the residual , example  2

Chapter 20, Problem 6E, Shoot to score, another one Using the regression output from Exercise 2, identify the residual , example  3

Blurred answer
Students have asked these similar questions
NC Current Students - North Ce X | NC Canvas Login Links - North ( X Final Exam Comprehensive x Cengage Learning x WASTAT - Final Exam - STAT → C webassign.net/web/Student/Assignment-Responses/submit?dep=36055360&tags=autosave#question3659890_9 Part (b) Draw a scatter plot of the ordered pairs. N Life Expectancy Life Expectancy 80 70 600 50 40 30 20 10 Year of 1950 1970 1990 2010 Birth O Life Expectancy Part (c) 800 70 60 50 40 30 20 10 1950 1970 1990 W ALT 林 $ # 4 R J7 Year of 2010 Birth F6 4+ 80 70 60 50 40 30 20 10 Year of 1950 1970 1990 2010 Birth Life Expectancy Ox 800 70 60 50 40 30 20 10 Year of 1950 1970 1990 2010 Birth hp P.B. KA & 7 80 % 5 H A B F10 711 N M K 744 PRT SC ALT CTRL
Harvard University California Institute of Technology Massachusetts Institute of Technology Stanford University Princeton University University of Cambridge University of Oxford University of California, Berkeley Imperial College London Yale University University of California, Los Angeles University of Chicago Johns Hopkins University Cornell University ETH Zurich University of Michigan University of Toronto Columbia University University of Pennsylvania Carnegie Mellon University University of Hong Kong University College London University of Washington Duke University Northwestern University University of Tokyo Georgia Institute of Technology Pohang University of Science and Technology University of California, Santa Barbara University of British Columbia University of North Carolina at Chapel Hill University of California, San Diego University of Illinois at Urbana-Champaign National University of Singapore McGill…
Name Harvard University California Institute of Technology Massachusetts Institute of Technology Stanford University Princeton University University of Cambridge University of Oxford University of California, Berkeley Imperial College London Yale University University of California, Los Angeles University of Chicago Johns Hopkins University Cornell University ETH Zurich University of Michigan University of Toronto Columbia University University of Pennsylvania Carnegie Mellon University University of Hong Kong University College London University of Washington Duke University Northwestern University University of Tokyo Georgia Institute of Technology Pohang University of Science and Technology University of California, Santa Barbara University of British Columbia University of North Carolina at Chapel Hill University of California, San Diego University of Illinois at Urbana-Champaign National University of Singapore…

Chapter 20 Solutions

Intro Stats, Books a la carte Plus NEW MyLab Statistics with Pearson eText -- Access Card Package (5th Edition)

Ch. 20 - Prob. 5ECh. 20 - Shoot to score, another one Using the regression...Ch. 20 - Prob. 7ECh. 20 - Shoot to score, hat trick Returning to the results...Ch. 20 - Prob. 9ECh. 20 - Shoot to score, number five What can the hockey...Ch. 20 - Prob. 11ECh. 20 - Prob. 12ECh. 20 - Prob. 13ECh. 20 - Prob. 14ECh. 20 - Prob. 15ECh. 20 - Shoot to score, double overtime Continuing from...Ch. 20 - Prob. 17ECh. 20 - Prob. 18ECh. 20 - Prob. 19ECh. 20 - Prob. 20ECh. 20 - Prob. 21ECh. 20 - Drug use 2013 The 2013 World Drug Report...Ch. 20 - Prob. 23ECh. 20 - Saratoga house prices How does the price of a...Ch. 20 - Prob. 25ECh. 20 - Prob. 26ECh. 20 - Prob. 27ECh. 20 - Prob. 28ECh. 20 - Prob. 29ECh. 20 - More cholesterol Look again at Exercise 28s...Ch. 20 - Prob. 31ECh. 20 - Cholesterol, finis Based on the regression output...Ch. 20 - Prob. 33ECh. 20 - Prob. 34ECh. 20 - Prob. 35ECh. 20 - Prob. 36ECh. 20 - Prob. 37ECh. 20 - Prob. 38ECh. 20 - Prob. 39ECh. 20 - Fuel economy A consumer organization has reported...Ch. 20 - Climate change 2016 Data collected from around the...Ch. 20 - Prob. 42ECh. 20 - Prob. 43ECh. 20 - Fuel economy, part III Consider again the data in...Ch. 20 - Climate change again Consider once again the CO2...Ch. 20 - Cereals A healthy cereal should be low in both...Ch. 20 - Brain size Does your IQ depend on the size of your...Ch. 20 - Prob. 48ECh. 20 - Prob. 49ECh. 20 - Prob. 50ECh. 20 - Ozone and population The Environmental Protection...Ch. 20 - Prob. 52ECh. 20 - Prob. 53ECh. 20 - More sales and profits Consider again the...Ch. 20 - Prob. 55ECh. 20 - Crawling Researchers at the University of Denver...Ch. 20 - Midterms The data set below shows midterm and...Ch. 20 - Prob. 58ECh. 20 - Prob. 59ECh. 20 - All the efficiency money can buy 2011 A sample of...Ch. 20 - Education and mortality The following software...Ch. 20 - Property assessments The following software output...Ch. 20 - Prob. 63ECh. 20 - Prob. 64E
Knowledge Booster
Background pattern image
Statistics
Learn more about
Need a deep-dive on the concept behind this application? Look no further. Learn more about this topic, statistics and related others by exploring similar questions and additional content below.
Similar questions
SEE MORE QUESTIONS
Recommended textbooks for you
Text book image
Glencoe Algebra 1, Student Edition, 9780079039897...
Algebra
ISBN:9780079039897
Author:Carter
Publisher:McGraw Hill
Text book image
Big Ideas Math A Bridge To Success Algebra 1: Stu...
Algebra
ISBN:9781680331141
Author:HOUGHTON MIFFLIN HARCOURT
Publisher:Houghton Mifflin Harcourt
Text book image
Holt Mcdougal Larson Pre-algebra: Student Edition...
Algebra
ISBN:9780547587776
Author:HOLT MCDOUGAL
Publisher:HOLT MCDOUGAL
The Shape of Data: Distributions: Crash Course Statistics #7; Author: CrashCourse;https://www.youtube.com/watch?v=bPFNxD3Yg6U;License: Standard YouTube License, CC-BY
Shape, Center, and Spread - Module 20.2 (Part 1); Author: Mrmathblog;https://www.youtube.com/watch?v=COaid7O_Gag;License: Standard YouTube License, CC-BY
Shape, Center and Spread; Author: Emily Murdock;https://www.youtube.com/watch?v=_YyW0DSCzpM;License: Standard Youtube License