
The comparative advantage of countries.
Answer to Problem 2P
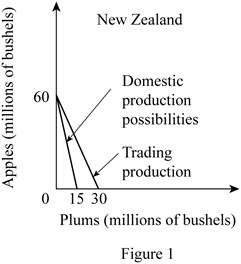
Option (a): New Zealand- The cost of producing 1 Apple is 0.25 plums and the cost of producing 1 plum is 4 Apples.
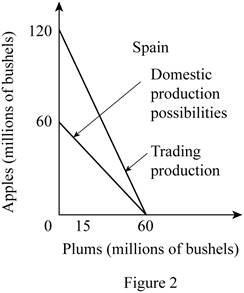
Spain- The cost of producing 1 Apple is 1 plum and the cost of producing 1 plum is 1 Apple.
Option (b): New Zealand should produce apples and Spain should produce plums.
Option (c): Graph
Option (d): The total gain of Apples is 20 and the total gain of plums is 10.
Explanation of Solution
The comparative advantage is the advantage that the country has over the competitor in the
Option (a):
In New Zealand, the production of 20 apples needs the resources which can alternatively be used for the production of 5 plums. Thus, the opportunity cost of producing 1 apple can be calculated by dividing the total units of plums given up by the total units of apples gained as follows:
Thus, the opportunity cost of producing 1 apple in New Zealand is 0.25 plums.
The opportunity cost of producing plum in New Zealand can be calculated by dividing the number of units of apples given up with the number of units of plums gained as follows:
So, the opportunity cost of producing 1 plum in New Zealand is 4 apples.
In Spain, the production of 20 apples needs the resources which can alternatively be used for the production of 20 plums. Thus, the opportunity cost of producing 1 apple can be calculated by dividing the total units of plums given up by the total units of apples gained as follows:
Thus, the opportunity cost of producing 1 apple in Spain is 1 plum.
The opportunity cost of producing plum in Spain can be calculated by dividing the number of units of apples given up with the number of units of plums gained as follows:
So, the opportunity cost of producing 1 plum in Spain is 1 apple.
Option (b):
The opportunity cost of producing a unit of apple is lower in New Zealand (0.25 Plum) compared to Spain (1 Plum). Thus, New Zealand should specialize in the production of apples.
The opportunity cost of producing a unit of plum is lower in Spain (1 Apple) compared to that in New Zealand (4 Apples). Thus, Spain should specialize in the production of plums.
Option (c):
Before the trade, the
According to the terms of trade of
Similarly, Spain can have 2 apples for 1 plum in the international trade which will increase their total possible consumption of apples from 60 million bushels to 120 million bushels. Thus, the vertical intercept of the Spain's production possibility curve will increase to 120 million bushels. So, the slope of the production possibility curve of Spain will decrease from -1 to -0.5.
The changes are shown in the diagram as follows:
Option (d):
The mixed product of New Zealand is B and of Spain is S. According to the table, the total output of apples in New Zealand at this mixed product is 20 million bushels and the output of plums is 10 million bushels. Similarly, at the given output combination S of Spain, the total output of apples is 20 million bushes and of plums is 40 million bushels.
Thus, the total output of the apple and plum before the trade can be calculated by adding the individual quantities of apples that are produced in New Zealand and Spain together are as follows:
Thus, the total output of apples before the trade was 40 million bushels.
Similarly, the total output of plums can be calculated by adding together each country’s outputs are as follows:
Thus, the total output of plums before the trade was 50 million bushels.
After the specialization by New Zealand in the production of apples, the total output of apples increased to 60 million bushels. Similarly, the specialization by Spain in the production of plums increased the total output of plums to 60 million bushels. Thus, total
Thus, the total output gain of apples is 20 million bushels.
Similarly, the total output gain in the case of plums can be calculated as follows:
Thus, the total output gain in plums is 10 million bushels.
Concept introduction:
Comparative advantage: It is the ability of the producer, firm or a country to produce a good or service at the lowest opportunity cost of production than the competitors.
Specialization: It is the process of identifying the product in which, the country has the comparative advantage in the form of lower opportunity cost of production. Thus, they can focus on the production of that commodity which will increase the output and they can engage in an international exchange in order to obtain the products in which they don’t have any comparative advantage.
Want to see more full solutions like this?
Chapter 20 Solutions
Macroeconomics: Principles, Problems, & Policies

- In a paragraph, no bullet, points please answer the question and follow the instructions. Give only the solution: Use the Feynman technique throughout. Assume that you’re explaining the answer to someone who doesn’t know the topic at all. 8. How does monetary policy supposedly translate into changes in AD?arrow_forwardIn a paragraph, no bullet, points please answer the question and follow the instructions. Give only the solution: Use the Feynman technique throughout. Assume that you’re explaining the answer to someone who doesn’t know the topic at all. 2. Carefully explain either Keynes’ “cookie jar” motive for holding money or the “saw-toothed model’s” motive for holding a safety stock.arrow_forwardIn a paragraph, no bullet, points please answer the question and follow the instructions. Give only the solution: Use the Feynman technique throughout. Assume that you’re explaining the answer to someone who doesn’t know the topic at all. 7.Carefully explain the Fisher equation for interest rates. What insight does it provide?arrow_forward
- In a paragraph, no bullet, points please answer the question and follow the instructions. Give only the solution: Use the Feynman technique throughout. Assume that you’re explaining the answer to someone who doesn’t know the topic at all. 3. Describe the general architecture of the Federal Reserve System.arrow_forwardIn a paragraph, no bullet, points please answer the question and follow the instructions. Give only the solution: Use the Feynman technique throughout. Assume that you’re explaining the answer to someone who doesn’t know the topic at all. 1. Define money. Carefully explain the three functions of money.arrow_forwardIn a paragraph, no bullet, points please answer the question and follow the instructions. Give only the solution: Use the Feynman technique throughout. Assume that you’re explaining the answer to someone who doesn’t know the topic at all. 5.Draw the Federal Reserve System’s Balance Sheet and briefly explain each of the main (highlighted in the PowerPoints and text) components.arrow_forward
- In a paragraph, no bullet, points please answer the question and follow the instructions. Give only the solution: Use the Feynman technique throughout. Assume that you’re explaining the answer to someone who doesn’t know the topic at all. 9. What are monetary rules? How are they carried out and what is the difference between monetary rules and discretionary behavior?arrow_forwardIn a paragraph, no bullet, points please answer the question and follow the instructions. Give only the solution: Use the Feynman technique throughout. Assume that you’re explaining the answer to someone who doesn’t know the topic at all. 4. What is interest payment on reserve balances used for? How does it work?arrow_forwardA linear programming computer package is needed. As part of the settlement for a class action lawsuit, Hoxworth Corporation must provide sufficient cash to make the following annual payments (in thousands of dollars). Year 1 2 3 4 5 6 Payment 170 195 220 265 295 440 The annual payments must be made at the beginning of each year. The judge will approve an amount that, along with earnings on its investment, will cover the annual payments. Investment of the funds will be limited to savings (at 4% annually) and government securities, at prices and rates currently quoted in The Wall Street Journal. Hoxworth wants to develop a plan for making the annual payments by investing in the following securities (par value = $1,000). Funds not invested in these securities will be placed in savings. Security Current Price Rate (%) Years to Maturity 1 $1,055 6.750 3 2 $1,000 5.125 4 Assume that interest is paid annually. The plan will be submitted to the judge and, if approved,…arrow_forward
- On the 1st of April 2018, the South African National Treasury increase the value-added tax rate from 14% to 15%. This policy change had a wide-ranging impact on society. Discuss some of the benefits and drawbacks of making use of this type of tax to generate government revenue and what we may expect in terms of its impact on inflation and GDP growth within the economy. Please use some of the economics graphs to explain some scenariosarrow_forwardEskom is South Africa’s monopoly power producer which the majority of South Africans depend on. Suppose there is extensive deregulation in the power industry. What is the impact of this deregulation on the industry? Help me on discussing the new market structure as well as the impact on supply and demand. Use the relevant diagrams.arrow_forwardDiscuss the impact of exchange rate volatility on the economy and its impact on your organisation. Make use of the relevant diagrams.arrow_forward

 Principles of Economics (12th Edition)EconomicsISBN:9780134078779Author:Karl E. Case, Ray C. Fair, Sharon E. OsterPublisher:PEARSON
 Engineering Economy (17th Edition)EconomicsISBN:9780134870069Author:William G. Sullivan, Elin M. Wicks, C. Patrick KoellingPublisher:PEARSON
 Principles of Economics (MindTap Course List)EconomicsISBN:9781305585126Author:N. Gregory MankiwPublisher:Cengage Learning
 Managerial Economics: A Problem Solving ApproachEconomicsISBN:9781337106665Author:Luke M. Froeb, Brian T. McCann, Michael R. Ward, Mike ShorPublisher:Cengage Learning
 Managerial Economics & Business Strategy (Mcgraw-...EconomicsISBN:9781259290619Author:Michael Baye, Jeff PrincePublisher:McGraw-Hill Education