the given case and explain the following statements.
Concept Introduction
Autarky: Autarky is a situation when no goods are imported from other country and the country is self-sufficient in its production.
Explanation of Solution
(a) Production Possibility Frontier of U.S. and Canada.
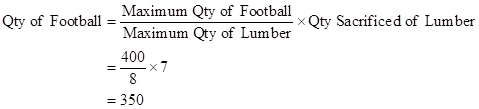
PPF of U.S.
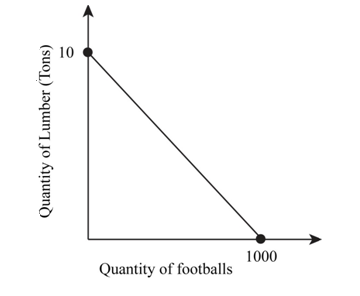
Fig 1
- The above graph shows the PPF of U.S. for the production of footballs and lumber with quantity of footballs on the x-axis and quantity of lumber on the y-axis.
- U.S. can produce maximum 10 tons of lumber with zero production of footballs or 1,000 footballs with zero production of lumber.
PPF of Canada.
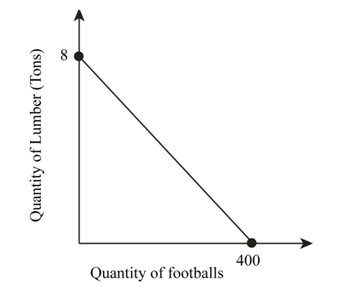
Fig 2
- The above graph shows the PPF of Canada for the production of footballs and lumber with quantity of footballs on the x-axis and quantity of lumber on the y-axis.
- Canada can produce maximum 8 tons of lumber with zero production of footballs or 400 footballs with zero production of lumber.
(b) Consumption of both products in autarky in the given case.
When U.S. consumes 500 footballs.
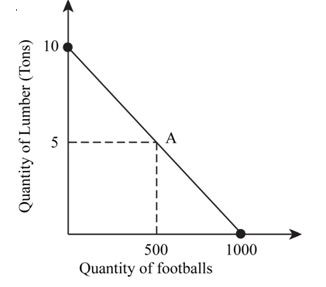
Fig 3
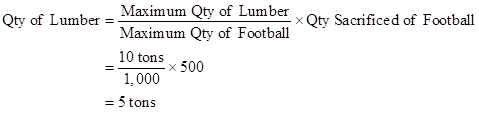
- If U.S. consumes 500 footballs, then in autarky, it can consume 5 tons of lumber as shown in the graph above.
- The quantity of lumber that can be consumed shall be calculated as follows:
When Canada consumes 1 ton of lumber.
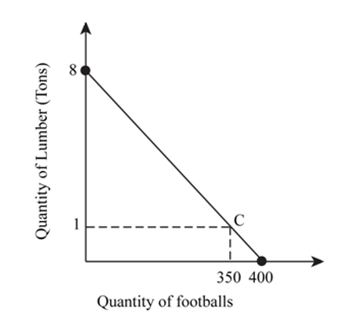
Fig 4
- If Canada consumes 1 ton of lumber, then in autarky, it can consume 350 footballs as shown in the graph above.
- The quantity of football that can be consumed shall be calculated as follows:
Conclusion:
Thus, the quantity consumed of lumber in U.S. is 5 tons and of football in Canada is 350.
(c) Country that has absolute advantage in production of lumber.
- A country is said to have an absolute advantage over the production of a good when it produces higher quantity of that good as compared to the other country.
- In the given case, the maximum quantity of lumber produced by U.S. is 10 tons and by Canada is 8 tons. Hence, U.S. has the absolute advantage over the production of lumber.
Conclusion:
Thus, the U.S. has the absolute advantage in lumber production.
(d) Country that has comparative advantage in production of lumber.
A country is said to have a comparative advantage over production of a good when its opportunity cost to produce that good is less as compared to the other country.
In the given case, if U.S. produces 1 ton of lumber, then it has to sacrifice production of 100 footballs, whereas if Canada produces 1 ton of lumber, then it has to sacrifice production of 50 footballs.
Hence, Canada has a comparative advantage in production of lumber because the opportunity cost of producing 1 ton of lumber is less in Canada than in the U.S.
Conclusion:
Thus, Canada has the comparative advantage in lumber production.
(e) Footballs produced by U.S. and lumber produced by Canada.
U.S. has a comparative advantage in the production of footballs and Canada has a comparative advantage in the production of lumber.
Hence, the maximum quantity of football produced by U.S. for trade is 1,000 and the maximum quantity of lumber produced by Canada for trade is 8 tons.
Conclusion:
Thus, U.S. will produce 1,000 footballs and Canada will produce 8 tons of lumber.
(f) Graphs showing the given situation for U.S. and Canada.
U.S. consumes 500 footballs and 7 tons of lumber.
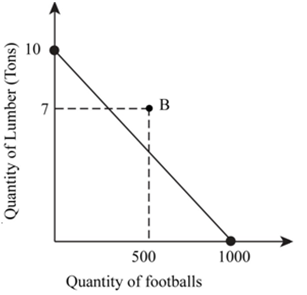
Fig 5
- The graph above shows the point B that denotes 500 footballs and 7 tons of lumber that falls outside the PPF.
- This implies that without international trade, it is not possible for U.S. to consume 500 footballs and 7 tons of lumber simultaneously.
Canada consumes 500 footballs and 1 ton of lumber.
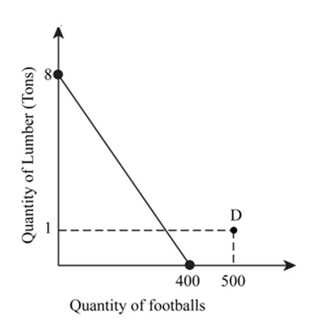
Fig 6
- The graph above shows the point D that denotes 500 footballs and 1 ton of lumber that falls outside the PPF.
- This implies that without international trade, it is not possible for Canada to consume 500 footballs and 1 ton of lumber simultaneously.
Conclusion:
Thus, it is not possible for U.S. and Canada to achieve the given production level without trade.
Want to see more full solutions like this?
Chapter 20 Solutions
Essentials of Economics

- how to caculate verible cost?arrow_forwardWhat is the deficit?arrow_forwardIdentify the two curves shown on the graph, and explain their upward and downward slopes. Why does curve Aintersect the horizontal axis? What is the significance of quantity d? What does erepresent? How would the optimal quantity of information change if the marginal benefit of information increased—that is, if the marginal benefit curve shifted upward?arrow_forward
- 6. Rent seeking The following graph shows the demand, marginal revenue, and marginal cost curves for a single-price monopolist that produces a drug that helps relieve arthritis pain. Place the grey point (star symbol) in the appropriate location on the graph to indicate the monopoly outcome such that the dashed lines reveal the profit-maximizing price and quantity of a single-price monopolist. Then, use the green rectangle (triangle symbols) to show the profits earned by the monopolist. 18 200 20 16 16 14 PRICE (Dollars per dose) 12 10 10 8 4 2 MC = ATC MR Demand 0 0 5 10 15 20 25 30 35 40 45 50 QUANTITY (Millions of doses per year) Monopoly Outcome Monopoly Profits Suppose that should the patent on this particular drug expire, the market would become perfectly competitive, with new firms immediately entering the market with essentially identical products. Further suppose that in this case the original firm will hire lobbyists and make donations to several key politicians to extend its…arrow_forwardConsider a call option on a stock that does not pay dividends. The stock price is $100 per share, and the risk-free interest rate is 10%. The call strike is $100 (at the money). The stock moves randomly with u=2 and d=0.5. 1. Write the system of equations to replicate the option using A shares and B bonds. 2. Solve the system of equations and determine the number of shares and the number of bonds needed to replicate the option. Show your answer with 4 decimal places (x.xxxx); do not round intermediate calculations. This is easy to do in Excel. A = B = 3. Use A shares and B bonds from the prior question to calculate the premium on the option. Again, do not round intermediate calculations and show your answer with 4 decimal places. Call premium =arrow_forwardAnswer these questions using replication or the risk neutral probability. Both methods will produce the same answer. Show your work to receive credit. 6. What is the premium of a call with a higher strike. Show your work to receive credit; do not round intermediate calculations. S0 = $100, u=2, d=0.5, r=10%, strike=$150arrow_forward
- Answer these questions using replication or the risk neutral probability. Both methods will produce the same answer.arrow_forwardProblem 2: At a raffle, 2000 tickets are sold at $5 each for five prizes of $2000, $1000, $500, $250, and $100. You buy one ticket. What is the expected value of your gain? 1. Find the gain for each prize. 2. Write a probability distribution for the possible gains. 3. Find the expected value. 4. Interpret the results.arrow_forwardThis activity focuses on developing direct and supported opinions using various sources of information on the importance of the following topics: non-renewable and renewable energies, economic factors and obstacles that can affect the relationship between international trade and economic growth, devaluation of the currency in countries, and the imbalance of economic equity. In this context, it is essential that, when studying and developing these topics, students understand the concepts of the value of currencies and that leads to devaluation, non-renewable and renewable energy resources, economic development and obstacles, distribution of wealth, economic growth and external and internal constraints, and about international trade as a growth factor. Thus, the objectives that are intended to be achieved are the following: Acquire knowledge about the concepts mentioned above. Determine relationships between economic growth and international trade. Understand what some limitations that…arrow_forward
- Consider a firm facing conventional production technology. The short run Production Function has a small range of increasing marginal product (increasing marginal returns) and then is subject to the Law of Diminishing Marginal Product (diminishing marginal returns). A. Putting quantity on the horizontal axis and dollars on the vertical axis, depict three important curves: Fixed Cost (FC), Variable Cost (VC), and Total Cost (TC). (Note that we are not asking you to depict average cost functions!) B. Please clearly indicate on this graph the range of quantities where the firm is experiencing (1) increasing marginal product and (2) diminishing marginal product. C. In a few sentences, please justify why you've made this specific classification of increasing/diminishing marginal product in part (b).arrow_forwardplease answer the following questions: What is money, and why does anyone want it? Explain the concept of the opportunity cost of holding money . Explain why an increase in U.S. interest rates relative to UK interest rates would affect the U.S.-UK exchange rate. Suppose that a person’s wealth is $50,000 and that her yearlyincome is $60,000. Also suppose that her money demand functionis given by Md = $Y10.35 - i2Derive the demand for bonds. Suppose the interest rate increases by 10 percentage points. What is the effect on her demand for bonds?b. What are the effects of an increase in income on her demand for money and her demand for bonds? Explain in wordsarrow_forwardDriving Quiz X My Course G city place w x D2L Login - Univ X D2L Login - Univ x D2L Login - U acmillanlearning.com/ihub/assessment/f188d950-dd73-11e0-9572-0800200c9a66/4db68a5e-69bb-4767-8d6c-a12d +1687 pts /1800 © Macmillan Learning Question 6 of 18 > The graph shows the average total cost (ATC) curve, the marginal cost (MC) curve, the average variable cost (AVC) curve, and the marginal revenue (MR) curve (which is also the market price) for a perfectly competitive firm that produces terrible towels. Answer the three questions, assuming that the firm is profit-maximizing and does not shut down in the short run. What is the firm's total revenue? S What is the firm's total cost? $ What is the firm's profit? (Enter a negative number for a loss.) $ Price $320 $300 $200 $150 205 260 336 365 Quantity MC ATC AVC MR=Parrow_forward

 Principles of Economics (12th Edition)EconomicsISBN:9780134078779Author:Karl E. Case, Ray C. Fair, Sharon E. OsterPublisher:PEARSON
 Engineering Economy (17th Edition)EconomicsISBN:9780134870069Author:William G. Sullivan, Elin M. Wicks, C. Patrick KoellingPublisher:PEARSON
 Principles of Economics (MindTap Course List)EconomicsISBN:9781305585126Author:N. Gregory MankiwPublisher:Cengage Learning
 Managerial Economics: A Problem Solving ApproachEconomicsISBN:9781337106665Author:Luke M. Froeb, Brian T. McCann, Michael R. Ward, Mike ShorPublisher:Cengage Learning
 Managerial Economics & Business Strategy (Mcgraw-...EconomicsISBN:9781259290619Author:Michael Baye, Jeff PrincePublisher:McGraw-Hill Education