
a.
To draw: A payoff and profit diagram to depict a straddle position when the exercise price is $130.
Introduction:
Straddle Strategy: It is one of the strategies used in manipulating the call and put options. In this strategy, the investor faces a position where the call option and the put option are placed in the same position with the same strike price (X) and time (t). In other words, a straddle is supposed to be the combined value of both the call option and the put option.
a.
Answer to Problem 16PS
We can conclude that an increase in price increased profit also.
Explanation of Solution
The information given to us is as follows:
| Statement showing the prices of the options in straddles and spreads | ||||||||
| Straddles and Spreads | ||||||||
| Stock prices | ||||||||
| Market Price | 116.5 | |||||||
| Market price | 130 | X110 Straddle | X120 Straddle | |||||
| Ending Stock price | Profit | Ending Stock price | Profit | |||||
| Buying options: | -15.4 | -24 | ||||||
| Strike | Price | Payoff | Profit | Return% | 50 | 24.6 | 50 | 36 |
| 110 | 22.8 | 20 | -2.8 | -12.28% | 60 | 14.6 | 60 | 26 |
| 120 | 16.8 | 10 | -6.8 | -40.48% | 70 | 4.6 | 70 | 16 |
| 130 | 13.6 | 0 | -13.6 | -100.00% | 80 | -5.4 | 80 | 6 |
| 140 | 10.3 | 0 | -10.3 | -100.00% | 90 | -15.4 | 90 | -4 |
| 100 | -25.4 | 100 | -14 | |||||
| Strike | Price | Payoff | Profit | Return% | 110 | -35.4 | 110 | -24 |
| 110 | 12.6 | 0 | -12.6 | -100% | 120 | -25.4 | 120 | -34 |
| 120 | 17.2 | 0 | -17.2 | -100% | 130 | -15.4 | 130 | -24 |
| 130 | 23.6 | 0 | -23.6 | -100% | 140 | -5.4 | 140 | -14 |
| 140 | 30.5 | 10 | -20.5 | -67.21% | 150 | 4.6 | 150 | -4 |
| 160 | 14.6 | 160 | 6 | |||||
| Straddle | Price | Payoff | Profit | Return% | 170 | 24.6 | 170 | 16 |
| 110 | 35.4 | 20 | -15.4 | -43.50% | 180 | 34.6 | 180 | 26 |
| 120 | 34 | 10 | -24 | -70.59% | 190 | 44.6 | 190 | 36 |
| 130 | 37.2 | 0 | -37.2 | -100% | 200 | 54.6 | 200 | 46 |
| 140 | 40.8 | 10 | -30.8 | -75.49% | 210 | 64.6 | 210 | 56 |
| Selling options: | ||||||||
| Call options | Price | Payoff | Profit | Return% | Ending | Bullish Spread | ||
| Stock price | 7.5 | |||||||
| 110 | 22.8 | -20 | 2.8 | 12.28% | 50 | -12.5 | ||
| 120 | 16.8 | -10 | 6.8 | 40.48% | 60 | -12.5 | ||
| 130 | 13.6 | 0 | 13.6 | 100.00% | 70 | -12.5 | ||
| 140 | 10.3 | 0 | 10.3 | 100.00% | 80 | -12.5 | ||
| 90 | -12.5 | |||||||
| Put options | Price | Payoff | Profit | Return% | 100 | -12.5 | ||
| 110 | 16.6 | 0 | 12.6 | 100.00% | 110 | -12.5 | ||
| 120 | 17.2 | 0 | 17.2 | 100.00% | 120 | -2.5 | ||
| 130 | 23.6 | 0 | 23.6 | 100.00% | 130 | 7.5 | ||
| 140 | 30.5 | 10 | 40.5 | 132.79% | 140 | 17.5 | ||
| 150 | 17.5 | |||||||
| Money spread | Price | Payoff | Profit | 160 | 17.5 | |||
| Bullish spread | 170 | 17.5 | ||||||
| Purchase of Call option at 110 | 22.8 | 20 | -2.8 | 180 | 17.5 | |||
| Selling of Call option at 140 | 10.3 | 0 | 10.3 | 190 | 17.5 | |||
| Combined profit | 20 | 7.5 | 200 | 17.5 | ||||
| 210 | 17.5 | |||||||
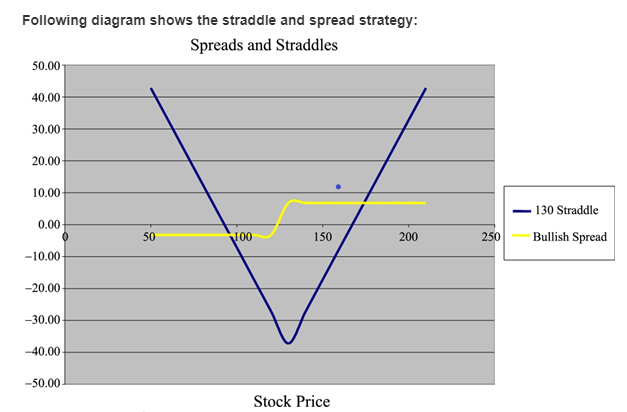
Let us use the same diagram for both the answers. Let us now understand the depiction of payoff and profit using a straddle strategy.
Like said before, in straddle strategy, both the call position and put position will be placed at the same place with the same strike price and expiration time. Let us observe the diagram. The blue shows the payoff and profit using a straddle strategy.
This diagram clears shows that when the price option of $110, the payoff is $20 and the net profit earned is $34.60. In a case where the price is $120, the profit earned is $44.60 and when the price rises to $130 the profit earned also rises to $54.60. Therefore, it means an increase in price increased profit also.
b.
To draw: A payoff and profit diagram to depict a bullish spread position when the exercise price is $120 and $130 assuming the excel position.
Introduction:
Bullish spread position: It is supposed to be a very optimistic option strategy. It is designed in such a way that profit can be earned even if there is a moderate increase in the price of the underlying asset.
b.
Answer to Problem 16PS
We can conclude that irrespective of a decline in market conditions, a net profit of $7.50 is earned.
Explanation of Solution
The information given to us is as follows:
| Statement showing the prices of the options in straddles and spreads | ||||||||
| Straddles and Spreads | ||||||||
| Stock prices | ||||||||
| Market Price | 116.5 | |||||||
| Market price | 130 | X110 Straddle | X120 Straddle | |||||
| Ending Stock price | Profit | Ending Stock price | Profit | |||||
| Buying options: | -15.4 | -24 | ||||||
| Strike | Price | Payoff | Profit | Return% | 50 | 24.6 | 50 | 36 |
| 110 | 22.8 | 20 | -2.8 | -12.28% | 60 | 14.6 | 60 | 26 |
| 120 | 16.8 | 10 | -6.8 | -40.48% | 70 | 4.6 | 70 | 16 |
| 130 | 13.6 | 0 | -13.6 | -100.00% | 80 | -5.4 | 80 | 6 |
| 140 | 10.3 | 0 | -10.3 | -100.00% | 90 | -15.4 | 90 | -4 |
| 100 | -25.4 | 100 | -14 | |||||
| Strike | Price | Payoff | Profit | Return% | 110 | -35.4 | 110 | -24 |
| 110 | 12.6 | 0 | -12.6 | -100% | 120 | -25.4 | 120 | -34 |
| 120 | 17.2 | 0 | -17.2 | -100% | 130 | -15.4 | 130 | -24 |
| 130 | 23.6 | 0 | -23.6 | -100% | 140 | -5.4 | 140 | -14 |
| 140 | 30.5 | 10 | -20.5 | -67.21% | 150 | 4.6 | 150 | -4 |
| 160 | 14.6 | 160 | 6 | |||||
| Straddle | Price | Payoff | Profit | Return% | 170 | 24.6 | 170 | 16 |
| 110 | 35.4 | 20 | -15.4 | -43.50% | 180 | 34.6 | 180 | 26 |
| 120 | 34 | 10 | -24 | -70.59% | 190 | 44.6 | 190 | 36 |
| 130 | 37.2 | 0 | -37.2 | -100% | 200 | 54.6 | 200 | 46 |
| 140 | 40.8 | 10 | -30.8 | -75.49% | 210 | 64.6 | 210 | 56 |
| Selling options: | ||||||||
| Call options | Price | Payoff | Profit | Return% | Ending | Bullish Spread | ||
| Stock price | 7.5 | |||||||
| 110 | 22.8 | -20 | 2.8 | 12.28% | 50 | -12.5 | ||
| 120 | 16.8 | -10 | 6.8 | 40.48% | 60 | -12.5 | ||
| 130 | 13.6 | 0 | 13.6 | 100.00% | 70 | -12.5 | ||
| 140 | 10.3 | 0 | 10.3 | 100.00% | 80 | -12.5 | ||
| 90 | -12.5 | |||||||
| Put options | Price | Payoff | Profit | Return% | 100 | -12.5 | ||
| 110 | 16.6 | 0 | 12.6 | 100.00% | 110 | -12.5 | ||
| 120 | 17.2 | 0 | 17.2 | 100.00% | 120 | -2.5 | ||
| 130 | 23.6 | 0 | 23.6 | 100.00% | 130 | 7.5 | ||
| 140 | 30.5 | 10 | 40.5 | 132.79% | 140 | 17.5 | ||
| 150 | 17.5 | |||||||
| Money spread | Price | Payoff | Profit | 160 | 17.5 | |||
| Bullish spread | 170 | 17.5 | ||||||
| Purchase of Call option at 110 | 22.8 | 20 | -2.8 | 180 | 17.5 | |||
| Selling of Call option at 140 | 10.3 | 0 | 10.3 | 190 | 17.5 | |||
| Combined profit | 20 | 7.5 | 200 | 17.5 | ||||
| 210 | 17.5 | |||||||

Let us use the same diagram for here also. Let us now understand the depiction of payoff and profit using a bullish spread strategy. The yellow line shown in the diagram depicts payoff and profit using a bullish spread strategy. When the diagram is observed, we find that when a call option is purchased at $110, the market is decreasing. When a call option is sold at $140, the net profit earned is $7.50. So, irrespective of a decline in market conditions, a net profit of $7.50 is earned.
Want to see more full solutions like this?
Chapter 20 Solutions
INVESTMENTS(LL)W/CONNECT

- AP Associates needs to raise $35 million. The investment banking firm of Squeaks, Emmie, andChippy will handle the transaction.a. If stock is used, 1,800,000 shares will be sold to the public at $21.30 per share. The corporation willreceive a net price of $20 per share. What is the percentage underwriting spread per share?b. If bonds are utilized, slightly over 37,500 bonds will be sold to the public at $1,000 per bond. Thecorporation will receive a net price of $980 per bond. What is the percentage of underwritingspread per bond? (Relate the dollar spread to the public price.)c. Which alternative has the larger percentage of spread?arrow_forwardGracie’s Dog Vests currently has 5,200,000 shares of stock outstanding and will report earnings of$8.8 million in the current year. The company is considering the issuance of 1,500,000 additionalshares that will net $28 per share to the corporation.a. What is the immediate dilution potential for this new stock issue?b. Assume that Grace’s Dog Vests can earn 8 percent on the proceeds of the stock issue in time toinclude them in the current year’s results. Calculate earnings per share. Should the new issuebe undertaken based on earnings per share?arrow_forwardYou plan to contribute seven payments of $2,000 a year, with the first payment made today (beginning of year 0) and the final payment made at the beginning of year 6, earning 11% annually. How much will you have after 6 years? a. $12,000 b.$21,718 c.$19,567 d.$3,741arrow_forward
- What is the full form of "CTO"? a.Central Trading Operation b.Capital take Over c.Chief Technology Officer d.Commerce Trade Officerarrow_forwardExplain. What is the full form of "EPS"? a.Exchange per Share b.Equity Private Selling c.Earnings per share d.Earning Preferred Stockarrow_forwardWhat is the full form of "MMKT"? a.Middle Market b.Management Key Trading c.Money Market d.Mutual Market Tradingexplainarrow_forward
 Essentials Of Business AnalyticsStatisticsISBN:9781285187273Author:Camm, Jeff.Publisher:Cengage Learning,
 Principles of Cost AccountingAccountingISBN:9781305087408Author:Edward J. Vanderbeck, Maria R. MitchellPublisher:Cengage Learning
 Essentials of Business Analytics (MindTap Course ...StatisticsISBN:9781305627734Author:Jeffrey D. Camm, James J. Cochran, Michael J. Fry, Jeffrey W. Ohlmann, David R. AndersonPublisher:Cengage Learning
 Excel Applications for Accounting PrinciplesAccountingISBN:9781111581565Author:Gaylord N. SmithPublisher:Cengage Learning