
(a)
To find:
The shortage and full economic
Answer to Problem 8CACQ
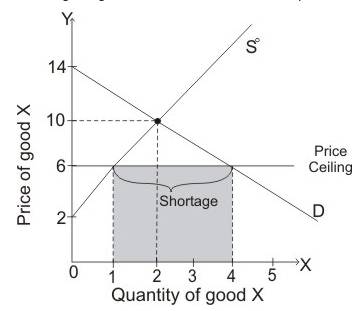
There is shortage of three units and thefull economic price is $12.
Explanation of Solution
The diagram given below shows the effect of
When
Full economic price is the total amount paid by the consumer in getting the product.
Price ceiling:
Price ceiling is the minimum price imposed by a government below which goods are supplied.
Full economic price:
Full economic price is the total amount paid by the consumer in getting the product below the imposed price ceiling.
(b)
To find:
The surplus as a result of imposition of $12 as price support and costs to the government in purchasing the units and all unsold units.
Answer to Problem 8CACQ
The costs to the government in purchasing units is $12.
Explanation of Solution
The diagram given below shows the effect of
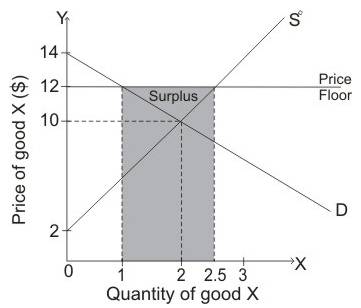
When demand curve is D and Supply curve is S0then equilibrium is attained when price of commodity is $10 and quantity demanded is 2 units. When government imposed the price floor of $12, then quantity supplied is greater than the quantity demanded so there is surplus of goods in an economy. Thus, there is surplus of 1.5units.
The shaded area in the diagram shows the surplus of good in an economy.
When price of commodity is more than the
Price floor:
Price floor is the maximum price which government has imposed above which goods are sold in the market.
(c)
To find:
The equilibrium price after excise tax of $6 is imposed, the price received by producers and the number of units that are sold.
Answer to Problem 8CACQ
The price paid by consumer is $12 per unit while the price received by the producer is $6 per unit. The number of units sold is 1 unit.
Explanation of Solution
When equilibrium price is $10 and government imposes excise tax of $6, then supply curve will shift leftwards from S0 to S1,which leads to rise in equilibrium price from $10 to $12. At equilibrium price of $12, quantity demanded is 1 unit.
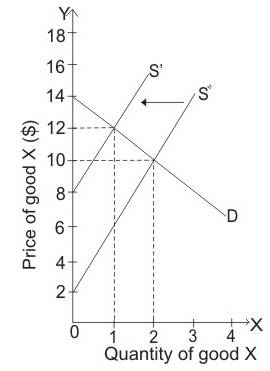
The price paid by consumer is $12 per unit while the price received by the producer is $6 per unit. The number of units sold is 1 unit.
Excise tax:
An excise tax is a tax imposed on manufacturers for producing goods.
(d)
To explain:
The level of
Answer to Problem 8CACQ
The value of
Explanation of Solution
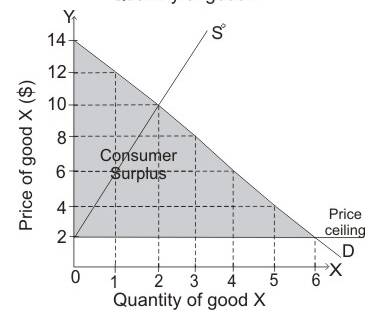
When demand curve D and supply curve S0 intersects then equilibrium is attained at price of $10 while equilibrium quantity is attained at 2 units.
Consumer surplus is the below demand curve and above the price level $10. So, consumer’s surplus is equal to:
Thus, the value of consumer surplus is $4.
Producer surplus is the area above curve and below the price level $10. So, producer’s surplus is equal to:
Thus, the value of producer surplus is $4.
Consumer surplus:
Consumer surplus is the variance in the amount that consumers are ready to pay and the price which is actually paid by them. The area of consumer surplus is below the demand curve and above the price.
Consumer surplus:
Producer surplus is the variance in the amount at which producers accept the quantity and the amount at which they sell. Producer surplus is the area above curve and below the price level.
(e)
To explain:
Whether the price can be benefitted with the price ceiling of $2.
Explanation of Solution
When price ceiling is $2 then producers do not want to produce any commodity while consumers want to consume any commodity which is produced.
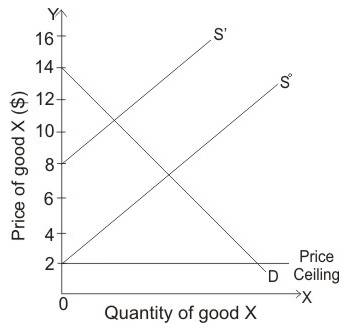
At price of $2, all consumers will benefit if producers supply commodity but at this low-price firms are not interested to produce any commodity.
Price ceiling:
Price ceiling is the maximum price imposed by a government below which goods are supplied.
Want to see more full solutions like this?
Chapter 2 Solutions
Managerial Economics And Business Strategy 9th Edition (without Access Code)

- PART II: Multipart Problems wood or solem of triflussd aidi 1. Assume that a society has a polluting industry comprising two firms, where the industry-level marginal abatement cost curve is given by: MAC = 24 - ()E and the marginal damage function is given by: MDF = 2E. What is the efficient level of emissions? b. What constant per-unit emissions tax could achieve the efficient emissions level? points) c. What is the net benefit to society of moving from the unregulated emissions level to the efficient level? In response to industry complaints about the costs of the tax, a cap-and-trade program is proposed. The marginal abatement cost curves for the two firms are given by: MAC=24-E and MAC2 = 24-2E2. d. How could a cap-and-trade program that achieves the same level of emissions as the tax be designed to reduce the costs of regulation to the two firms?arrow_forwardOnly #4 please, Use a graph please if needed to help provearrow_forwarda-carrow_forward
- For these questions, you must state "true," "false," or "uncertain" and argue your case (roughly 3 to 5 sentences). When appropriate, the use of graphs will make for stronger answers. Credit will depend entirely on the quality of your explanation. 1. If the industry facing regulation for its pollutant emissions has a lot of political capital, direct regulatory intervention will be more viable than an emissions tax to address this market failure. 2. A stated-preference method will provide a measure of the value of Komodo dragons that is more accurate than the value estimated through application of the travel cost model to visitation data for Komodo National Park in Indonesia. 3. A correlation between community demographics and the present location of polluting facilities is sufficient to claim a violation of distributive justice. olsvrc Q 4. When the damages from pollution are uncertain, a price-based mechanism is best equipped to manage the costs of the regulator's imperfect…arrow_forwardFor environmental economics, question number 2 only please-- thank you!arrow_forwardFor these questions, you must state "true," "false," or "uncertain" and argue your case (roughly 3 to 5 sentences). When appropriate, the use of graphs will make for stronger answers. Credit will depend entirely on the quality of your explanation. 1. If the industry facing regulation for its pollutant emissions has a lot of political capital, direct regulatory intervention will be more viable than an emissions tax to address this market failure. cullog iba linevoz ve bubivorearrow_forward
- Exercise 3 The production function of a firm is described by the following equation Q=10,000-3L2 where L stands for the units of labour. a) Draw a graph for this equation. Use the quantity produced in the y-axis, and the units of labour in the x-axis. b) What is the maximum production level? c) How many units of labour are needed at that point? d) Provide one reference with you answer.arrow_forwardExercise 1 Consider the market supply curve which passes through the intercept and from which the market equilibrium data is known, this is, the price and quantity of equilibrium PE=50 and QE=2000. Considering those two points, find the equation of the supply. Draw a graph of this line. Provide one reference with your answer. Exercise 2 Considering the previous supply line, determine if the following demand function corresponds to the market demand equilibrium stated above. QD=3000-2p.arrow_forwardConsider the market supply curve which passes through the intercept and from which the marketequilibrium data is known, this is, the price and quantity of equilibrium PE=50 and QE=2000.a. Considering those two points, find the equation of the supply. b. Draw a graph of this line.arrow_forward
- Government Purchases and Tax Revenues A B GDP T₂ Refer to the diagram. Discretionary fiscal policy designed to slow the economy is illustrated by Multiple Choice the shift of curve T₁ to T2. a movement from d to balong curve T₁.arrow_forwardSection III: Empirical Findings: Descriptive Statistics and inferential statistics………………..40% Descriptive statistics provide details about the Y variable, based on the sample for the 10-year period. Here, you use Excell or manually compute Mean or the average income per capita. Interpret the meaning of average income per capita. Draw the line chart showing the educational performance over the time-period of your study. Label the Vertical axis as Y performance and X axis as the explanatory variable (X1) . Do the same thing between Y and X2 Empirical/ Inferential Statistics: Here, use the sample information to perform the following: Draw the Scatter plot and impose the trend line: showing the Y variable and explanatory variables ( X1). Draw the scatter plot and impose the tend line: Showing Y and X2. Does your evidence (data) support your theory? Refer to the trend line: Is the relationship positive or negative as expected? Based on the data sheet below: Years Y ( per…arrow_forwardSection III: Empirical Findings: Descriptive Statistics and inferential statistics………………..40% Descriptive statistics provide details about the Y variable, based on the sample for the 10-year period. Here, you use Excell or manually compute Mean or the average income per capita. Interpret the meaning of average income per capita. Draw the line chart showing the educational performance over the time-period of your study. Label the Vertical axis as Y performance and X axis as the explanatory variable (X1) . Do the same thing between Y and X2 Empirical/ Inferential Statistics: Here, use the sample information to perform the following: Draw the Scatter plot and impose the trend line: showing the Y variable and explanatory variables ( X1). Draw the scatter plot and impose the tend line: Showing Y and X2. Does your evidence (data) support your theory? Refer to the trend line: Is the relationship positive or negative as expected? Create graphs based on table below; Years Y ( per…arrow_forward
 Managerial Economics: Applications, Strategies an...EconomicsISBN:9781305506381Author:James R. McGuigan, R. Charles Moyer, Frederick H.deB. HarrisPublisher:Cengage Learning
 Survey of Economics (MindTap Course List)EconomicsISBN:9781305260948Author:Irvin B. TuckerPublisher:Cengage Learning


