
Connect hosted by ALEKS for Elementary Statistics: A Step By Step Approach
10th Edition
ISBN: 9781260041774
Author: Allan Bluman
Publisher: Mcgraw-hill Higher Education (us)
expand_more
expand_more
format_list_bulleted
Videos
Textbook Question
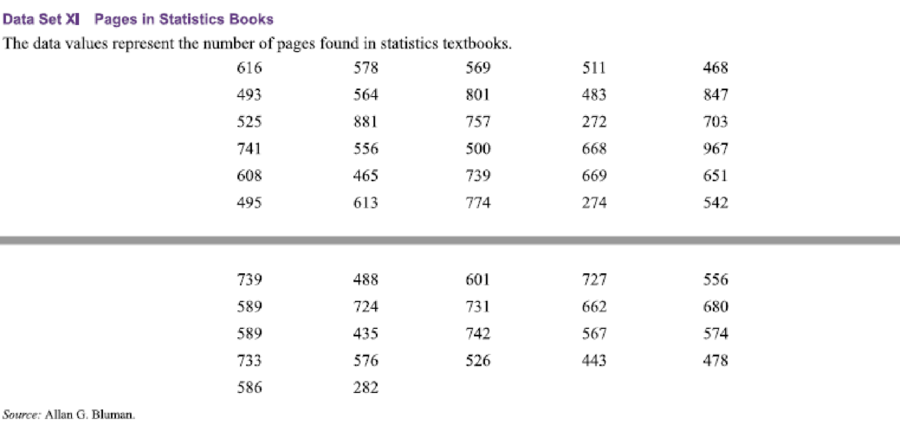
Chapter 2, Problem 5DA
Using the data from Data Set XI in Appendix B, construct a frequency distribution and draw a frequency
Expert Solution & Answer
Want to see the full answer?
Check out a sample textbook solution
Students have asked these similar questions
One hundred students were surveyed about their preference between dogs and cats. The following two-way table displays data for the sample of students who responded to the survey.
Preference
Male
Female
TOTAL
Prefers dogs
\[36\]
\[20\]
\[56\]
Prefers cats
\[10\]
\[26\]
\[36\]
No preference
\[2\]
\[6\]
\[8\]
TOTAL
\[48\]
\[52\]
\[100\]
problem 1
Find the probability that a randomly selected student prefers dogs.Enter your answer as a fraction or decimal.
\[P\left(\text{prefers dogs}\right)=\]
Incorrect
Check
Hide explanation
Preference
Male
Female
TOTAL
Prefers dogs
\[\blueD{36}\]
\[\blueD{20}\]
\[\blueE{56}\]
Prefers cats
\[10\]
\[26\]
\[36\]
No preference
\[2\]
\[6\]
\[8\]
TOTAL
\[48\]
\[52\]
\[100\]
There were \[\blueE{56}\] students in the sample who preferred dogs out of \[100\] total students.
Business discuss
You have been hired as an intern to run analyses on the data and report the results back to Sarah; the five questions that Sarah needs you to address are given below.
Does there appear to be a positive or negative relationship between price and screen size? Use a scatter plot to examine the relationship.
Determine and interpret the correlation coefficient between the two variables. In your interpretation, discuss the direction of the relationship (positive, negative, or zero relationship). Also discuss the strength of the relationship.
Estimate the relationship between screen size and price using a simple linear regression model and interpret the estimated coefficients. (In your interpretation, tell the dollar amount by which price will change for each unit of increase in screen size).
Include the manufacturer dummy variable (Samsung=1, 0 otherwise) and estimate the relationship between screen size, price and manufacturer dummy as a multiple linear regression model.
Interpret the…
Chapter 2 Solutions
Connect hosted by ALEKS for Elementary Statistics: A Step By Step Approach
Ch. 2.1 - Ages of Presidents at Inauguration The data...Ch. 2.1 - List five reasons for organizing data into a...Ch. 2.1 - Name the three types of frequency distributions,...Ch. 2.1 - How many classes should frequency distributions...Ch. 2.1 - What are open-ended frequency distributions? Why...Ch. 2.1 - For Exercises 58, find the class boundaries,...Ch. 2.1 - For Exercises 58, find the class boundaries,...Ch. 2.1 - For Exercises 58, find the class boundaries,...Ch. 2.1 - For Exercises 58, find the class boundaries,...Ch. 2.1 - For Exercises 912, show frequency distributions...
Ch. 2.1 - For Exercises 912, show frequency distributions...Ch. 2.1 - For Exercises 912, show frequency distributions...Ch. 2.1 - For Exercises 912, show frequency distributions...Ch. 2.1 - Favorite Coffee Flavor A survey was taken asking...Ch. 2.1 - Trust in Internet Information A survey was taken...Ch. 2.1 - Eating at Fast Food Restaurants A survey was taken...Ch. 2.1 - Ages of Dogs The ages of 20 dogs in a pet shelter...Ch. 2.1 - Maximum Wind Speeds The data show the maximum wind...Ch. 2.1 - Stories in the Worlds Tallest Buildings The number...Ch. 2.1 - Ages of Declaration of Independence Signers The...Ch. 2.1 - Salaries of Governors Here are the salaries (in...Ch. 2.1 - Charity Donations A random sample of 30 large...Ch. 2.1 - Unclaimed Expired Prizes The number of unclaimed...Ch. 2.1 - Scores in the Rose Bowl The data show the scores...Ch. 2.1 - Consumption of Natural Gas Construct a frequency...Ch. 2.1 - Average Wind Speeds A sample of 40 large cities...Ch. 2.1 - Percentage of People Who Completed 4 or More Years...Ch. 2.1 - JFK Assassination A researcher conducted a survey...Ch. 2.1 - The Value of Pi The ratio of the circumference of...Ch. 2.2 - Selling Real Estate Assume you are a realtor in...Ch. 2.2 - Do Students Need Summer Development? For 108...Ch. 2.2 - Bear Kills The number of bears killed in 2014 for...Ch. 2.2 - Pupils Per Teacher The average number of pupils...Ch. 2.2 - Number of College Faculty The number of faculty...Ch. 2.2 - Railroad Crossing Accidents The data show the...Ch. 2.2 - NFL Salaries The salaries (in millions of dollars)...Ch. 2.2 - Suspension Bridges Spans The following frequency...Ch. 2.2 - Costs of Utilities The frequency distribution...Ch. 2.2 - Air Pollution One of the air pollutants that is...Ch. 2.2 - Making the Grade The frequency distributions shown...Ch. 2.2 - Blood Glucose Levels The frequency distribution...Ch. 2.2 - Waiting Times The frequency distribution shows the...Ch. 2.2 - Construct a histogram, frequency polygon, and...Ch. 2.2 - Construct a histogram, frequency polygon, and...Ch. 2.2 - Construct a histogram, frequency polygon, and...Ch. 2.2 - Construct a histogram, frequency polygon, and...Ch. 2.2 - Home Runs The data show the most number of home...Ch. 2.2 - Protein Grams in Fast Food The amount of protein...Ch. 2.2 - Using the histogram shown here, do the following....Ch. 2.2 - Using the results from Exercise 19. answer these...Ch. 2.2 - Math SAT Scores Shown is an ogive depicting the...Ch. 2.3 - Applying the Concepts 23 Causes of Accidental...Ch. 2.3 - Tech Company Employees Construct a vertical and...Ch. 2.3 - Worldwide Sales of Fast Foods The worldwide sales...Ch. 2.3 - Gulf Coastlines Construct a Pareto chart for the...Ch. 2.3 - Roller Coaster Mania The World Roller Coaster...Ch. 2.3 - Online Ad Spending The amount spent (in billions...Ch. 2.3 - Violent Crimes The number of all violent crimes...Ch. 2.3 - U.S. Licensed Drivers 70 or Older Draw a time...Ch. 2.3 - Valentines Day Spending The data show the average...Ch. 2.3 - Credit Cards Draw and analyze a pie graph for the...Ch. 2.3 - Reasons We Travel The following data are based on...Ch. 2.3 - Kids and Guns The following data show where...Ch. 2.3 - Colors of Automobiles The popular car colors are...Ch. 2.3 - Ages of Football Players The data show the ages of...Ch. 2.3 - Teacher Strikes In Pennsylvania the numbers of...Ch. 2.3 - Years of Experience The data show the number of...Ch. 2.3 - Commuting Times Fifty off-campus students were...Ch. 2.3 - Home Run Club There are 43 Major League baseball...Ch. 2.3 - Calories in Salad Dressings A listing of calories...Ch. 2.3 - Length of Major Rivers The data show the lengths...Ch. 2.3 - Math and Reading Achievement Scores The math and...Ch. 2.3 - State which type of graph (Pareto chart, time...Ch. 2.3 - State which graph (Pareto chart, time series...Ch. 2.3 - U.S. Health Dollar The U.S. health dollar is spent...Ch. 2.3 - Prob. 24ECh. 2.3 - Cost of Milk The graph shows the increase in the...Ch. 2.3 - U.S. Population by Age The following information...Ch. 2.3 - Chicago Homicides Draw and compare two time series...Ch. 2.3 - Trip Reimbursements The average amount requested...Ch. 2 - How People Get Their News The Brunswick Research...Ch. 2 - Mens World Hockey Champions The United States won...Ch. 2 - BUN Count The blood urea nitrogen (BUN) count of...Ch. 2 - Wind Speed The data show the average wind speed...Ch. 2 - Waterfall Heights The data show the heights (in...Ch. 2 - Ages of the Vice Presidents at the Time of Their...Ch. 2 - Find the relative frequency for the frequency...Ch. 2 - Find the relative frequency for the frequency...Ch. 2 - Construct a histogram, frequency polygon, and...Ch. 2 - Construct a histogram, frequency polygon, and...Ch. 2 - Construct a histogram, frequency polygon, and...Ch. 2 - Construct a histogram, frequency polygon, and...Ch. 2 - Non-Alcoholic Beverages The data show the yearly...Ch. 2 - Calories of Nuts The data show the number of...Ch. 2 - Crime The data show the percentage of the types of...Ch. 2 - AID: 1825 | 31/5/2018 16. Pet Care The data (in...Ch. 2 - Broadway Stage Engagements The data show the...Ch. 2 - High School Dropout Rate The data show the high...Ch. 2 - Prob. 2.3.19RECh. 2 - Smart Phone Insurance Construct and analyze a pie...Ch. 2 - Prob. 2.3.21RECh. 2 - Prob. 2.3.22RECh. 2 - Weights of Football Players A local football team...Ch. 2 - Public Libraries The numbers of public libraries...Ch. 2 - Pain Relief The graph below shows the time it...Ch. 2 - Casino Payoffs The graph shows the payoffs...Ch. 2 - From the Data Bank located in Appendix B, choose...Ch. 2 - Prob. 2DACh. 2 - From the Data Bank, select at least 30 subjects...Ch. 2 - Prob. 4DACh. 2 - Using the data from Data Set XI in Appendix B,...Ch. 2 - Prob. 7DACh. 2 - Determine whether each statement is true or false....Ch. 2 - Prob. 2CQCh. 2 - Prob. 3CQCh. 2 - Frequency distributions can aid the researcher in...Ch. 2 - Determine whether each statement is true or false....Ch. 2 - Prob. 6CQCh. 2 - Determine whether each statement is true or false....Ch. 2 - Prob. 8CQCh. 2 - What are the boundaries for 8.68.8? a. 89 b....Ch. 2 - What graph should be used to show the relationship...Ch. 2 - Prob. 11CQCh. 2 - The three types of frequency distributions are...Ch. 2 - In a frequency distribution, the number of classes...Ch. 2 - Prob. 14CQCh. 2 - Data collected over a period of time can be...Ch. 2 - A statistical device used in exploratory data...Ch. 2 - On a Pareto chart, the frequencies should be...Ch. 2 - Housing Arrangements A questionnaire on housing...Ch. 2 - Housing Arrangements A questionnaire on housing...Ch. 2 - Prob. 20CQCh. 2 - Construct a histogram, a frequency polygon, and an...Ch. 2 - Coal Consumption The following data represent the...Ch. 2 - Construct a histogram, frequency polygon, and...Ch. 2 - Recycled Trash Construct a Pareto chart and a...Ch. 2 - Identity Thefts The results of a survey of 84...Ch. 2 - Needless Deaths of Children The New England...Ch. 2 - Prob. 27CQCh. 2 - Parking Meter Revenue In a small city the number...Ch. 2 - Prob. 29CQCh. 2 - The Great Lakes Shown are various statistics about...Ch. 2 - Teacher Strikes In Pennsylvania there were more...
Knowledge Booster


Learn more about
Need a deep-dive on the concept behind this application? Look no further. Learn more about this topic, statistics and related others by exploring similar questions and additional content below.Similar questions
- Does there appear to be a positive or negative relationship between price and screen size? Use a scatter plot to examine the relationship. How to take snapshots: if you use a MacBook, press Command+ Shift+4 to take snapshots. If you are using Windows, use the Snipping Tool to take snapshots. Question 1: Determine and interpret the correlation coefficient between the two variables. In your interpretation, discuss the direction of the relationship (positive, negative, or zero relationship). Also discuss the strength of the relationship. Value of correlation coefficient: Direction of the relationship (positive, negative, or zero relationship): Strength of the relationship (strong/moderate/weak): Question 2: Estimate the relationship between screen size and price using a simple linear regression model and interpret the estimated coefficients. In your interpretation, tell the dollar amount by which price will change for each unit of increase in screen size. (The answer for the…arrow_forwardIn this problem, we consider a Brownian motion (W+) t≥0. We consider a stock model (St)t>0 given (under the measure P) by d.St 0.03 St dt + 0.2 St dwt, with So 2. We assume that the interest rate is r = 0.06. The purpose of this problem is to price an option on this stock (which we name cubic put). This option is European-type, with maturity 3 months (i.e. T = 0.25 years), and payoff given by F = (8-5)+ (a) Write the Stochastic Differential Equation satisfied by (St) under the risk-neutral measure Q. (You don't need to prove it, simply give the answer.) (b) Give the price of a regular European put on (St) with maturity 3 months and strike K = 2. (c) Let X = S. Find the Stochastic Differential Equation satisfied by the process (Xt) under the measure Q. (d) Find an explicit expression for X₁ = S3 under measure Q. (e) Using the results above, find the price of the cubic put option mentioned above. (f) Is the price in (e) the same as in question (b)? (Explain why.)arrow_forwardProblem 4. Margrabe formula and the Greeks (20 pts) In the homework, we determined the Margrabe formula for the price of an option allowing you to swap an x-stock for a y-stock at time T. For stocks with initial values xo, yo, common volatility σ and correlation p, the formula was given by Fo=yo (d+)-x0Þ(d_), where In (±² Ꭲ d+ õ√T and σ = σ√√√2(1 - p). дго (a) We want to determine a "Greek" for ỡ on the option: find a formula for θα (b) Is дго θα positive or negative? (c) We consider a situation in which the correlation p between the two stocks increases: what can you say about the price Fo? (d) Assume that yo< xo and p = 1. What is the price of the option?arrow_forward
- We consider a 4-dimensional stock price model given (under P) by dẴ₁ = µ· Xt dt + йt · ΣdŴt where (W) is an n-dimensional Brownian motion, π = (0.02, 0.01, -0.02, 0.05), 0.2 0 0 0 0.3 0.4 0 0 Σ= -0.1 -4a За 0 0.2 0.4 -0.1 0.2) and a E R. We assume that ☑0 = (1, 1, 1, 1) and that the interest rate on the market is r = 0.02. (a) Give a condition on a that would make stock #3 be the one with largest volatility. (b) Find the diversification coefficient for this portfolio as a function of a. (c) Determine the maximum diversification coefficient d that you could reach by varying the value of a? 2arrow_forwardQuestion 1. Your manager asks you to explain why the Black-Scholes model may be inappro- priate for pricing options in practice. Give one reason that would substantiate this claim? Question 2. We consider stock #1 and stock #2 in the model of Problem 2. Your manager asks you to pick only one of them to invest in based on the model provided. Which one do you choose and why ? Question 3. Let (St) to be an asset modeled by the Black-Scholes SDE. Let Ft be the price at time t of a European put with maturity T and strike price K. Then, the discounted option price process (ert Ft) t20 is a martingale. True or False? (Explain your answer.) Question 4. You are considering pricing an American put option using a Black-Scholes model for the underlying stock. An explicit formula for the price doesn't exist. In just a few words (no more than 2 sentences), explain how you would proceed to price it. Question 5. We model a short rate with a Ho-Lee model drt = ln(1+t) dt +2dWt. Then the interest rate…arrow_forwardIn this problem, we consider a Brownian motion (W+) t≥0. We consider a stock model (St)t>0 given (under the measure P) by d.St 0.03 St dt + 0.2 St dwt, with So 2. We assume that the interest rate is r = 0.06. The purpose of this problem is to price an option on this stock (which we name cubic put). This option is European-type, with maturity 3 months (i.e. T = 0.25 years), and payoff given by F = (8-5)+ (a) Write the Stochastic Differential Equation satisfied by (St) under the risk-neutral measure Q. (You don't need to prove it, simply give the answer.) (b) Give the price of a regular European put on (St) with maturity 3 months and strike K = 2. (c) Let X = S. Find the Stochastic Differential Equation satisfied by the process (Xt) under the measure Q. (d) Find an explicit expression for X₁ = S3 under measure Q. (e) Using the results above, find the price of the cubic put option mentioned above. (f) Is the price in (e) the same as in question (b)? (Explain why.)arrow_forward
- The managing director of a consulting group has the accompanying monthly data on total overhead costs and professional labor hours to bill to clients. Complete parts a through c. Question content area bottom Part 1 a. Develop a simple linear regression model between billable hours and overhead costs. Overhead Costsequals=212495.2212495.2plus+left parenthesis 42.4857 right parenthesis42.485742.4857times×Billable Hours (Round the constant to one decimal place as needed. Round the coefficient to four decimal places as needed. Do not include the $ symbol in your answers.) Part 2 b. Interpret the coefficients of your regression model. Specifically, what does the fixed component of the model mean to the consulting firm? Interpret the fixed term, b 0b0, if appropriate. Choose the correct answer below. A. The value of b 0b0 is the predicted billable hours for an overhead cost of 0 dollars. B. It is not appropriate to interpret b 0b0, because its value…arrow_forwardUsing the accompanying Home Market Value data and associated regression line, Market ValueMarket Valueequals=$28,416+$37.066×Square Feet, compute the errors associated with each observation using the formula e Subscript ieiequals=Upper Y Subscript iYiminus−ModifyingAbove Upper Y with caret Subscript iYi and construct a frequency distribution and histogram. LOADING... Click the icon to view the Home Market Value data. Question content area bottom Part 1 Construct a frequency distribution of the errors, e Subscript iei. (Type whole numbers.) Error Frequency minus−15 comma 00015,000less than< e Subscript iei less than or equals≤minus−10 comma 00010,000 0 minus−10 comma 00010,000less than< e Subscript iei less than or equals≤minus−50005000 5 minus−50005000less than< e Subscript iei less than or equals≤0 21 0less than< e Subscript iei less than or equals≤50005000 9…arrow_forwardThe managing director of a consulting group has the accompanying monthly data on total overhead costs and professional labor hours to bill to clients. Complete parts a through c Overhead Costs Billable Hours345000 3000385000 4000410000 5000462000 6000530000 7000545000 8000arrow_forward
- Using the accompanying Home Market Value data and associated regression line, Market ValueMarket Valueequals=$28,416plus+$37.066×Square Feet, compute the errors associated with each observation using the formula e Subscript ieiequals=Upper Y Subscript iYiminus−ModifyingAbove Upper Y with caret Subscript iYi and construct a frequency distribution and histogram. Square Feet Market Value1813 911001916 1043001842 934001814 909001836 1020002030 1085001731 877001852 960001793 893001665 884001852 1009001619 967001690 876002370 1139002373 1131001666 875002122 1161001619 946001729 863001667 871001522 833001484 798001589 814001600 871001484 825001483 787001522 877001703 942001485 820001468 881001519 882001518 885001483 765001522 844001668 909001587 810001782 912001483 812001519 1007001522 872001684 966001581 86200arrow_forwarda. Find the value of A.b. Find pX(x) and py(y).c. Find pX|y(x|y) and py|X(y|x)d. Are x and y independent? Why or why not?arrow_forwardThe PDF of an amplitude X of a Gaussian signal x(t) is given by:arrow_forward
arrow_back_ios
SEE MORE QUESTIONS
arrow_forward_ios
Recommended textbooks for you
 Holt Mcdougal Larson Pre-algebra: Student Edition...AlgebraISBN:9780547587776Author:HOLT MCDOUGALPublisher:HOLT MCDOUGAL
 Glencoe Algebra 1, Student Edition, 9780079039897...AlgebraISBN:9780079039897Author:CarterPublisher:McGraw Hill
 Big Ideas Math A Bridge To Success Algebra 1: Stu...AlgebraISBN:9781680331141Author:HOUGHTON MIFFLIN HARCOURTPublisher:Houghton Mifflin Harcourt
 College Algebra (MindTap Course List)AlgebraISBN:9781305652231Author:R. David Gustafson, Jeff HughesPublisher:Cengage Learning
Holt Mcdougal Larson Pre-algebra: Student Edition...
Algebra
ISBN:9780547587776
Author:HOLT MCDOUGAL
Publisher:HOLT MCDOUGAL
Glencoe Algebra 1, Student Edition, 9780079039897...
Algebra
ISBN:9780079039897
Author:Carter
Publisher:McGraw Hill
Big Ideas Math A Bridge To Success Algebra 1: Stu...
Algebra
ISBN:9781680331141
Author:HOUGHTON MIFFLIN HARCOURT
Publisher:Houghton Mifflin Harcourt
College Algebra (MindTap Course List)
Algebra
ISBN:9781305652231
Author:R. David Gustafson, Jeff Hughes
Publisher:Cengage Learning
How to make Frequency Distribution Table / Tally Marks and Frequency Distribution Table; Author: Reenu Math;https://www.youtube.com/watch?v=i_A6RiE8tLE;License: Standard YouTube License, CC-BY
Frequency distribution table in statistics; Author: Math and Science;https://www.youtube.com/watch?v=T7KYO76DoOE;License: Standard YouTube License, CC-BY
Frequency Distribution Table for Grouped/Continuous data | Math Dot Com; Author: Maths dotcom;https://www.youtube.com/watch?v=ErnccbXQOPY;License: Standard Youtube License