Concept explainers
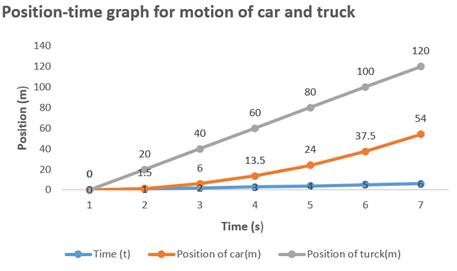
The position time graph for the car and truck for time
Explanation of Solution
Given info:
Car is at rest at time
Car is accelerating constantly at
At time
Formula used:
Formula to find the distance travelled in term of velocity and time is,
Another formula to find the distance travelled in term of speed and acceleration is,
Here,
To draw a position versus time graph we have to draw a table showing position of car from time
Find the position of car:
As car is starting from rest its initial velocity is zero. Finding the position of car using equation-2.
By changing the value of time in equation-3 from
| Time | |||||||
| Position of car ( ) |
Find the position of truck using equation-1.
By changing the value of time in equation-4 from
| Time | |||||||
| Position of car ( ) |
We draw position time graph by taking value of time on x-axis and position on y-axis.
The shape of position time graph for car is curve and for truck is a straight line.
Graph shows car is accreting from rest and truck is moving with constant velocity.

Conclusion:
Thus,the shape of position time graph for car is curve and for truck is straight line.
Graph shows car is accreting from rest and truck is moving with constant velocity.
Want to see more full solutions like this?
Chapter 2 Solutions
COLLEGE PHYSICS LL W/ 6 MONTH ACCESS
- One hundred dollars is invested at 7.2% interest compounded annually. Determine how much the investment is worth after: a. I year b. 5 years c. 10 years d. 20 years e. Use your answers to parts (a)-(d) to estimate the doubling time for the investment.arrow_forward6) A farmer has 60 acres on which to plant oats or corn. Each acre of oats requires 100 lbs of fertilizer and 1 hour of labor. Each acre of corn requires 50 lbs of fertilizer and 2 hours of labor. The farmer has 5000 lbs of fertilizer and 100 hours available for labor. If the profit is $60 from each acre of oats and $100 from each acre of corn, what planting combination will produce the greatest total profit? a) Fill in the following chart to help organize the information given in the problem: Oats Labor Fertilizer Land Profit b) Write down the question of interest. Corn Available c) Define variables to answer the question of interest. Call these x and y. d) Write the objective function to answer the question of interest. e) List any constraints given in the problem.arrow_forwardI need help with number 5.arrow_forward
- 3) Use the following system of linear inequalities graphed below to answer the questions. a) Use the graph to write the symbolic form of the system of linear inequalities. b) Is (-4,2) a solution to the system? Explain. 5 -7 -5 -3 -2 0 2 3 4 $ 6 -2 -6 -7arrow_forward) Graph the feasible region subject to the following constraints. x + y ≤ 6 y ≤ 2x x ≥ 0, y ≥ 0 P + xarrow_forwardSolve the following system of equations: 50x+20y=1800 10x+3y=300arrow_forward
- > > > we are hiring Salesforce Admin Location: Remote Key Responsibilities: Administer Salesforce Sales & Revenue Cloud (CPQ & Billing) Configure workflows, validation rules & dashboards Automate processes using Flows & Process Builder Collaborate with Sales, Finance & Marketing teams Manage user roles & security Apply: Hr@forcecraver.comarrow_forwardAnswer this questionarrow_forward1. vector projection. Assume, ER1001 and you know the following: ||||=4, 7=-0.5.7. For each of the following, explicitly compute the value. འབ (a) (b) (c) (d) answer. Explicitly compute ||y7||. Explain your answer. Explicitly compute the cosine similarity of and y. Explain your Explicitly compute (x, y). Explain your answer. Find the projection of onto y and the projection of onto .arrow_forward
- 2. Answer the following questions using vectors u and v. --0-0-0 = find the the cosine similarity and the angle between u and v. འརྒྱ (a) (b) find the scalar projection of u onto v. (c) find the projection of u onto v. (d) (e) (f) find the scalar projection of onto u. find the projection of u onto u. find the projection of u onto and the projection of onto . (Hint: find the inner product and verify the orthogonality)arrow_forwardPlease type out answerarrow_forwardPlease type out answerarrow_forward
 Functions and Change: A Modeling Approach to Coll...AlgebraISBN:9781337111348Author:Bruce Crauder, Benny Evans, Alan NoellPublisher:Cengage Learning

- Algebra & Trigonometry with Analytic GeometryAlgebraISBN:9781133382119Author:SwokowskiPublisher:Cengage
 Trigonometry (MindTap Course List)TrigonometryISBN:9781337278461Author:Ron LarsonPublisher:Cengage Learning
 Linear Algebra: A Modern IntroductionAlgebraISBN:9781285463247Author:David PoolePublisher:Cengage Learning


