The points in the scatter plot show the number of firearms per 100 persons and the number of deaths per 100,000 persons for industrialized countries with the highest death rates. a . Use the two points whose coordinates are shown by the voice balloons to find an equation in point-slope form for the line that models deaths per 100,000 persons, y, as a function of firearms per 100 persons, x. b . Write the equation in part (a) in slope-intercept form. Use function notation. c . France has 32 firearms per 100 persons. Use the appropriate point in the scatter plot to estimate that country’s deaths per 100,000 persons. d . Use the function from part (b) to find the number of deaths per 100,000 persons for France. Round to one decimal place. Does the function underestimate or overestimate the deaths per 100,000 persons that you estimated in part (c)? How is this shown by the line in the scatter plot?
The points in the scatter plot show the number of firearms per 100 persons and the number of deaths per 100,000 persons for industrialized countries with the highest death rates. a . Use the two points whose coordinates are shown by the voice balloons to find an equation in point-slope form for the line that models deaths per 100,000 persons, y, as a function of firearms per 100 persons, x. b . Write the equation in part (a) in slope-intercept form. Use function notation. c . France has 32 firearms per 100 persons. Use the appropriate point in the scatter plot to estimate that country’s deaths per 100,000 persons. d . Use the function from part (b) to find the number of deaths per 100,000 persons for France. Round to one decimal place. Does the function underestimate or overestimate the deaths per 100,000 persons that you estimated in part (c)? How is this shown by the line in the scatter plot?
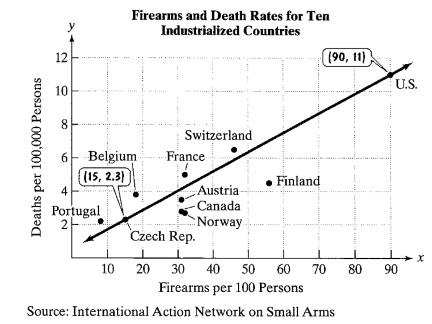
The points in the scatter plot show the number of firearms per 100 persons and the number of deaths per 100,000 persons for industrialized countries with the highest death rates.
a. Use the two points whose coordinates are shown by the voice balloons to find an equation in point-slope form for the line that models deaths per 100,000 persons, y, as a function of firearms per 100 persons, x.
b. Write the equation in part (a) in slope-intercept form. Use function notation.
c. France has 32 firearms per 100 persons. Use the appropriate point in the scatter plot to estimate that country’s deaths per 100,000 persons.
d. Use the function from part (b) to find the number of deaths per 100,000 persons for France. Round to one decimal place. Does the function underestimate or overestimate the deaths per 100,000 persons that you estimated in part (c)? How is this shown by the line in the scatter plot?
Formula Formula Point-slope equation: The point-slope equation of a line passing through the point (x 1 , y 1 ) with slope m , is given by the following formula: y - y 1 = m x - x 1 Example: The point-slope equation of a line passing through (2, -6) with slope 5 is given by: y - (-6) = 5(x - 2) y + 6 = 5(x - 2)
Complete the table below. For solutions, round to the nearest whole
number.
Let the universal set be whole numbers 1
through 20 inclusive. That is,
U = {1, 2, 3, 4, . . ., 19, 20}. Let A, B, and C
be subsets of U.
Let A be the set of all prime numbers:
A = {2, 3, 5, 7, 11, 13, 17, 19}
Let B be the set of all odd numbers:
B = {1,3,5,7, . . ., 17, 19}
Let C be the set of all square numbers:
C = {1,4,9,16}
A research team consists of 4 senior researchers and 10 research assistants. The team needs to select 2 senior researchers and 2 research assistants to attend a conference. How many different ways can the group being sent to the conference be formed?
Need a deep-dive on the concept behind this application? Look no further. Learn more about this topic, algebra and related others by exploring similar questions and additional content below.


 Glencoe Algebra 1, Student Edition, 9780079039897...AlgebraISBN:9780079039897Author:CarterPublisher:McGraw Hill
 Elementary AlgebraAlgebraISBN:9780998625713Author:Lynn Marecek, MaryAnne Anthony-SmithPublisher:OpenStax - Rice University
 Algebra: Structure And Method, Book 1AlgebraISBN:9780395977224Author:Richard G. Brown, Mary P. Dolciani, Robert H. Sorgenfrey, William L. ColePublisher:McDougal Littell
 College Algebra (MindTap Course List)AlgebraISBN:9781305652231Author:R. David Gustafson, Jeff HughesPublisher:Cengage Learning