
Videos
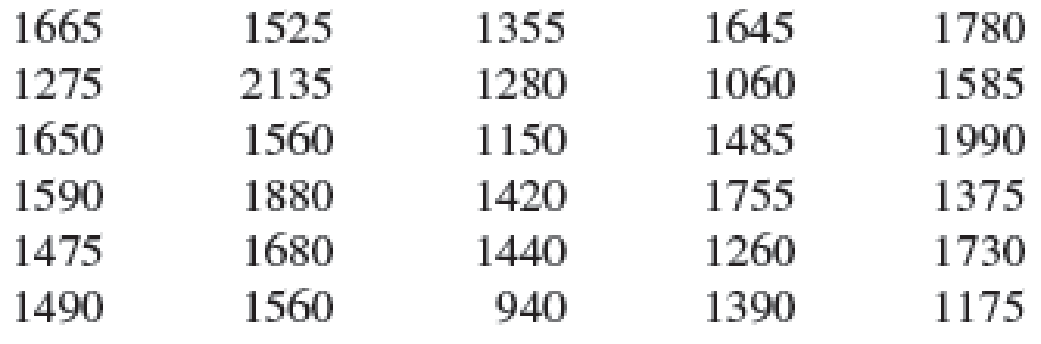
SAT Scores. The SAT is a standardized test used by many colleges and universities in their admission decisions. More than one million high school students take the SAT each year. The current version of the SAT includes three parts: reading comprehension, mathematics, and writing. A perfect combined score for all three parts is 2400. A sample of SAT scores for the combined three-part SAT are as follows:
- a. Show a frequency distribution and histogram. Begin with the first class starting at 800 and use a class width of 200.
- b. Comment on the shape of the distribution.
- c. What other observations can be made about the SAT scores based on the tabular and graphical summaries?
a.
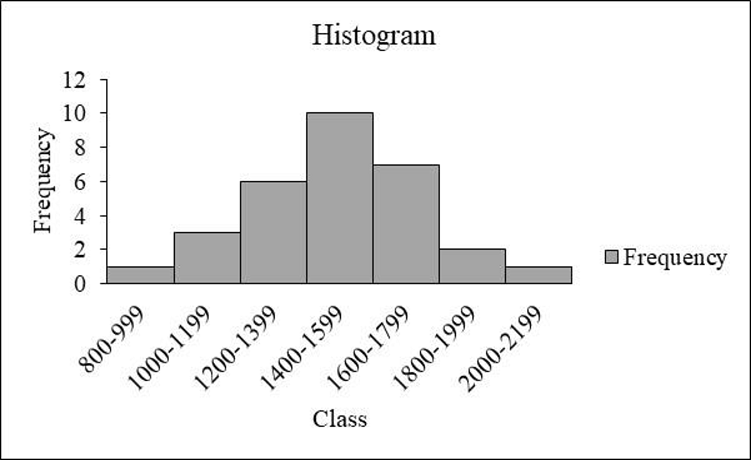
Construct the frequency distribution and histogram for the data.
Answer to Problem 44SE
The frequency distribution is tabulated below:
| Class | Tally | Frequency |
| 800-999 | 1 | |
| 1000-1199 | 3 | |
| 1200-1399 | 6 | |
| 1400-1599 | 10 | |
| 1600-1799 | 7 | |
| 1800-1999 | 2 | |
| 2000-2199 | 1 | |
| Total | 30 |
- Output using EXCEL is given below:
Explanation of Solution
Calculation:
The data represent the sample of SAT scores for the combined three part sat scores.
The frequencies are calculated using the tally mark and the method of grouping is used because the range of the data is from 800 to 2,199. Here, the number of times each class level repeats is the frequency of that particular class.
- From the given data set, it is given that the class should be approximately started with the class of 800 and with the class width of 200.
- Make a tally mark for each value in the corresponding class and continue for all the values in the data.
- The number of tally marks in each class represents the frequency f of that class.
Similarly, the frequency of the remaining classes for the data set is given below:
| Class | Tally | Frequency |
| 800-999 | 1 | |
| 1,000-1,199 | 3 | |
| 1,200-1,399 | 6 | |
| 1,400-1,599 | 10 | |
| 1,600-1,799 | 7 | |
| 1,800-1,999 | 2 | |
| 2,000-2,199 | 1 | |
| Total | 30 |
Software procedure:
Step-by-step procedure to draw the frequency histogram chart using EXCEL software:
- In Excel sheet, enter Class in one column and Frequency in another column.
- Select the data and then choose Insert > Insert Column Bar Charts.
- Select Clustered Column Under More Column Charts.
- Double click the bars
- In Format Data Series, enter 0 in Gap Width under Series Options.
b.
Comment the shape of the distribution.
Answer to Problem 44SE
The distribution of sat score is approximately symmetric.
Explanation of Solution
Symmetric distribution:
If the left and right sides of the distribution are approximately equal or mirror images of each other, then the distribution is symmetric distribution.
From the graph, it is observed that the left and right sides of the histogram are approximately equal. Hence, the shape of the distribution is a bell-shaped curve.
Thus, it can be concluded that the distribution is approximately symmetric.
c.
Comment the observations of sat scores based on the tabular and graphical summary.
Explanation of Solution
From the data and the histogram, it is observed that approximately 33 percent of sat score (frequency about 10 of 30) lie between 1,400 and 1,599.
- Moreover, the score less than 800 or greater than 2,200 are unusual, and the average value of sat scores is over 1,500.
Want to see more full solutions like this?
Chapter 2 Solutions
Modern Business Statistics with Microsoft Office Excel (with XLSTAT Education Edition Printed Access Card) (MindTap Course List)


 C++ for Engineers and ScientistsComputer ScienceISBN:9781133187844Author:Bronson, Gary J.Publisher:Course Technology Ptr
 C++ Programming: From Problem Analysis to Program...Computer ScienceISBN:9781337102087Author:D. S. MalikPublisher:Cengage Learning
 EBK JAVA PROGRAMMINGComputer ScienceISBN:9781337671385Author:FARRELLPublisher:CENGAGE LEARNING - CONSIGNMENT
 COMPREHENSIVE MICROSOFT OFFICE 365 EXCEComputer ScienceISBN:9780357392676Author:FREUND, StevenPublisher:CENGAGE LProgramming Logic & Design ComprehensiveComputer ScienceISBN:9781337669405Author:FARRELLPublisher:CengageNp Ms Office 365/Excel 2016 I NtermedComputer ScienceISBN:9781337508841Author:CareyPublisher:Cengage