a.
To find: The five-number summary for the distribution of revenues for the top global 500
To explain: Why the five-number summary suggests that the distribution is right skewed.
a.
Answer to Problem 2.52E
The five-number summary for the distribution of revenues for the top global 500 is
The difference between the
Explanation of Solution
Given info: Table 2.3gives the highest revenues for 30 companies from global 500 companies in 2014.
Calculation:
Five-number summary:
The five-number summary of a distribution consists of minimum, the first
Software procedure:
Step-by-step software procedure for five-number summary using MINITAB software is as follows:
- Choose Stat > Basic Statistics > Display
Descriptive Statistics . - In Variables enter the columns GLOBE500.
- Choose option statistics, and select minimum, first quartile, median, third quartile, maximum.
- Click OK.
Output using MINITAB software is as follows:
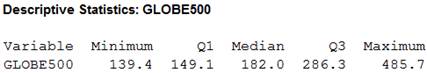
The five-number summary for the distribution of the highest revenues of 30 companies for the top global 500 is
Justification:
The distance from median and minimum is,
The distance from the maximum to the median is,
From the five-number summary, the distribution is right skewed because the difference between the median and minimum is less than the difference between the median and maximum.
b.
To find: The companies which are outliers according to the
To check: Whether the
b.
Answer to Problem 2.52E
According to
Yes, the
Explanation of Solution
Calculation:
From the output in part (a)
The difference between the first quartile and the third quartile is considered as interquartile range.
Thus,
For revenues of 30 companies,
The
A observation is a suspected as outlier if it is more than
The
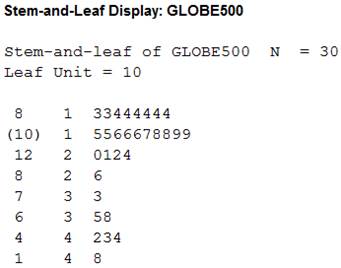
Stemplot:
Software procedure:
Step-by-step software procedure to draw stemplot using MINITAB software is as follows:
- Select Graph>Stem and leaf.
- Select the column of GLOBE500 in Graph variables.
- Select OK.
Output of stemplot is shown below:
Justification:
The stemplot does not show any outliers which indicates that the
c.
To explain: The common feature that the 30 companies in the Table 2.3 share.
To find: The proportion of the total of the global 500 revenues accounted by the 30 companies.
c.
Answer to Problem 2.52E
The common feature that the 30 companies share is that they are the high outliers and have high revenues out of global 500 companies.
The proportion of the total global 500 revenues by the 30 companies is 0.06.
Explanation of Solution
Justification:
From the global 500 companies, 30 companies in Table2.3 have high revenues than the remaining companies, and these 30 companies are the high outliers that has a common feature of sharing.
The proportion of the total global 500 companies accounted by the 30 companies is:
Thus, the proportion of the total global 500 revenues by the 30 companies is 0.06.
Want to see more full solutions like this?
Chapter 2 Solutions
BASIC PRACTICE OF STATS-LL W/SAPLINGPLU

- help me with abc please. please handwrite if possible. please don't use AI tools to answerarrow_forwardhelp me with abc please. please handwrite if possible. please don't use AI tools to answerarrow_forwardhelp me with abc please. please handwrite if possible. please don't use AI tools to answer.arrow_forward
- Please help me with this statistics questionarrow_forwardPlease help me with the following statistic questionarrow_forwardTo evaluate the success of a 1-year experimental program designed to increase the mathematical achievement of underprivileged high school seniors, a random sample of participants in the program will be selected and their mathematics scores will be compared with the previous year’s statewide average of 525 for underprivileged seniors. The researchers want to determine whether the experimental program has increased the mean achievement level over the previous year’s statewide average. If alpha=.05, what sample size is needed to have a probability of Type II error of at most .025 if the actual mean is increased to 550? From previous results, sigma=80.arrow_forward
- Please help me answer the following questions from this problem.arrow_forwardPlease help me find the sample variance for this question.arrow_forwardCrumbs Cookies was interested in seeing if there was an association between cookie flavor and whether or not there was frosting. Given are the results of the last week's orders. Frosting No Frosting Total Sugar Cookie 50 Red Velvet 66 136 Chocolate Chip 58 Total 220 400 Which category has the greatest joint frequency? Chocolate chip cookies with frosting Sugar cookies with no frosting Chocolate chip cookies Cookies with frostingarrow_forward
- The table given shows the length, in feet, of dolphins at an aquarium. 7 15 10 18 18 15 9 22 Are there any outliers in the data? There is an outlier at 22 feet. There is an outlier at 7 feet. There are outliers at 7 and 22 feet. There are no outliers.arrow_forwardStart by summarizing the key events in a clear and persuasive manner on the article Endrikat, J., Guenther, T. W., & Titus, R. (2020). Consequences of Strategic Performance Measurement Systems: A Meta-Analytic Review. Journal of Management Accounting Research?arrow_forwardThe table below was compiled for a middle school from the 2003 English/Language Arts PACT exam. Grade 6 7 8 Below Basic 60 62 76 Basic 87 134 140 Proficient 87 102 100 Advanced 42 24 21 Partition the likelihood ratio test statistic into 6 independent 1 df components. What conclusions can you draw from these components?arrow_forward
 MATLAB: An Introduction with ApplicationsStatisticsISBN:9781119256830Author:Amos GilatPublisher:John Wiley & Sons Inc
 Probability and Statistics for Engineering and th...StatisticsISBN:9781305251809Author:Jay L. DevorePublisher:Cengage Learning
 Statistics for The Behavioral Sciences (MindTap C...StatisticsISBN:9781305504912Author:Frederick J Gravetter, Larry B. WallnauPublisher:Cengage Learning
 Elementary Statistics: Picturing the World (7th E...StatisticsISBN:9780134683416Author:Ron Larson, Betsy FarberPublisher:PEARSON
 The Basic Practice of StatisticsStatisticsISBN:9781319042578Author:David S. Moore, William I. Notz, Michael A. FlignerPublisher:W. H. Freeman
 Introduction to the Practice of StatisticsStatisticsISBN:9781319013387Author:David S. Moore, George P. McCabe, Bruce A. CraigPublisher:W. H. Freeman