
Mind on Statistics
5th Edition
ISBN: 9781285463186
Author: Jessica M. Utts, Robert F. Heckard
Publisher: Brooks Cole
expand_more
expand_more
format_list_bulleted
Concept explainers
Videos
Textbook Question
Chapter 2, Problem 2.37E
This is the same as Exercise ¡.1. The 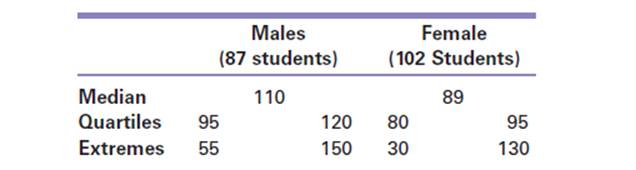
Give a numerical value for each of the following:
a. The fastest speed driven by anyone in the class.
b. The slowest of the ‘fastest speeds” driven by a male.
c. The speed for which one-fourth of the women had driven at that speed or faster.
d. The proportion of females who had driven 89 mph or faster.
e. The number of females who had driven 89 mph or faster.
Expert Solution & Answer
Want to see the full answer?
Check out a sample textbook solution
Students have asked these similar questions
BUSINESS DISCUSS
A researcher wishes to estimate, with 90% confidence, the population proportion of adults who support labeling
legislation for genetically modified organisms (GMOs). Her estimate must be accurate within 4% of the true proportion.
(a) No preliminary estimate is available. Find the minimum sample size needed.
(b) Find the minimum sample size needed, using a prior study that found that 65% of the respondents said they support
labeling legislation for GMOs.
(c) Compare the results from parts (a) and (b).
...
(a) What is the minimum sample size needed assuming that no prior information is available?
n =
(Round up to the nearest whole number as needed.)
The table available below shows the costs per mile (in cents) for a sample of automobiles. At a = 0.05, can you conclude that at least one mean
cost per mile is different from the others?
Click on the icon to view the data table.
Let Hss, HMS, HLS, Hsuv and Hмy represent the mean costs per mile for small sedans, medium sedans, large sedans, SUV 4WDs, and minivans
respectively. What are the hypotheses for this test?
OA. Ho: Not all the means are equal.
Ha Hss HMS HLS HSUV HMV
B. Ho Hss HMS HLS HSUV = μMV
Ha: Hss *HMS *HLS*HSUV * HMV
C. Ho Hss HMS HLS HSUV =μMV
= =
H: Not all the means are equal.
D. Ho Hss HMS
HLS HSUV HMV
Ha Hss HMS
HLS =HSUV = HMV
Chapter 2 Solutions
Mind on Statistics
Ch. 2 - A sociologist assembles a dataset consisting of...Ch. 2 - Suppose that in a national survey of 620 randomly...Ch. 2 - In each situation, explain whether it would be...Ch. 2 - In each situation, explain whether it would be...Ch. 2 - For each of the following statistical summaries,...Ch. 2 - Prob. 2.6ECh. 2 - Prob. 2.7ECh. 2 - Read Case Study 1.5 (p. 4) about prayer and blood...Ch. 2 - Prob. 2.9ECh. 2 - Read Case Study 1.6 (p.5) about aspirin and heart...
Ch. 2 - Prob. 2.11ECh. 2 - For each of the following characteristics of an...Ch. 2 - Prob. 2.13ECh. 2 - Prob. 2.14ECh. 2 - Prob. 2.15ECh. 2 - Prob. 2.16ECh. 2 - Prob. 2.17ECh. 2 - For each pair of variables, specify which variable...Ch. 2 - Prob. 2.19ECh. 2 - Prob. 2.20ECh. 2 - Prob. 2.21ECh. 2 - Prob. 2.22ECh. 2 - Prob. 2.23ECh. 2 - Prob. 2.24ECh. 2 - Prob. 2.25ECh. 2 - Prob. 2.26ECh. 2 - Table 2.1 (P. 20) summarized frequency of seatbelt...Ch. 2 - Prob. 2.28ECh. 2 - Prob. 2.29ECh. 2 - Refer to Exercise 2.27. Students also were asked...Ch. 2 - Prob. 2.31ECh. 2 - Prob. 2.32ECh. 2 - Prob. 2.33ECh. 2 - Prob. 2.34ECh. 2 - Prob. 2.35ECh. 2 - Prob. 2.36ECh. 2 - This is the same as Exercise ¡.1. The five-number...Ch. 2 - Prob. 2.38ECh. 2 - Prob. 2.39ECh. 2 - Prob. 2.40ECh. 2 - Prob. 2.41ECh. 2 - Prob. 2.42ECh. 2 - Prob. 2.43ECh. 2 - Hand et al. (1994, p. 148) provide data on the...Ch. 2 - The following stem-and-leaf plot is for the mean...Ch. 2 - Prob. 2.46ECh. 2 - Prob. 2.47ECh. 2 - Prob. 2.48ECh. 2 - Prob. 2.49ECh. 2 - Prob. 2.50ECh. 2 - Prob. 2.51ECh. 2 - Prob. 2.52ECh. 2 - Prob. 2.53ECh. 2 - Prob. 2.54ECh. 2 - Prob. 2.55ECh. 2 - Prob. 2.56ECh. 2 - Prob. 2.57ECh. 2 - Prob. 2.58ECh. 2 - Prob. 2.59ECh. 2 - Prob. 2.60ECh. 2 - Prob. 2.61ECh. 2 - Students in a statistics class wrote as many...Ch. 2 - Prob. 2.63ECh. 2 - The following cholesterol levels for n = 20...Ch. 2 - The weights (in pounds) for nine men on the...Ch. 2 - A set of eight systolic blood pressures follows:...Ch. 2 - Prob. 2.67ECh. 2 - Prob. 2.68ECh. 2 - Prob. 2.69ECh. 2 - Prob. 2.70ECh. 2 - Prob. 2.71ECh. 2 - Prob. 2.72ECh. 2 - Prob. 2.73ECh. 2 - The football team at the school of one of the...Ch. 2 - Prob. 2.75ECh. 2 - Prob. 2.76ECh. 2 - Prob. 2.77ECh. 2 - Prob. 2.78ECh. 2 - Prob. 2.79ECh. 2 - Prob. 2.80ECh. 2 - Prob. 2.81ECh. 2 - Prob. 2.82ECh. 2 - Prob. 2.83ECh. 2 - Prob. 2.84ECh. 2 - Prob. 2.85ECh. 2 - Prob. 2.86ECh. 2 - Prob. 2.87ECh. 2 - Suppose that the distribution of speeds at an...Ch. 2 - Prob. 2.89ECh. 2 - Prob. 2.90ECh. 2 - Prob. 2.91ECh. 2 - Prob. 2.92ECh. 2 - Prob. 2.93ECh. 2 - The data for Exercise 2.66 was this set of...Ch. 2 - Prob. 2.95ECh. 2 - If you learn that your score on an exam was 80 and...Ch. 2 - The scores on the final exam in a course with a...Ch. 2 - Prob. 2.98ECh. 2 - Prob. 2.99ECh. 2 - Prob. 2.100ECh. 2 - Head circumferences of adult males have a...Ch. 2 - Prob. 2.102ECh. 2 - Suppose verbal SAT scores for students admitted to...Ch. 2 - Prob. 2.104ECh. 2 - Prob. 2.105ECh. 2 - Prob. 2.106ECh. 2 - Prob. 2.107ECh. 2 - Remember that a resistant statistic is a numerical...Ch. 2 - Prob. 2.109ECh. 2 - Prob. 2.110ECh. 2 - Prob. 2.111ECh. 2 - Prob. 2.112ECh. 2 - Prob. 2.113ECh. 2 - Prob. 2.114ECh. 2 - Prob. 2.115ECh. 2 - Prob. 2.116ECh. 2 - Prob. 2.117ECh. 2 - Prob. 2.118ECh. 2 - Prob. 2.119ECh. 2 - Prob. 2.120ECh. 2 - Prob. 2.121ECh. 2 - Prob. 2.122ECh. 2 - The data for 103 women’s right handspans are shown...Ch. 2 - Prob. 2.124ECh. 2 - Prob. 2.125ECh. 2 - Prob. 2.126ECh. 2 - Prob. 2.127ECh. 2 - Prob. 2.128ECh. 2 - Prob. 2.129ECh. 2 - Prob. 2.130ECh. 2 - Prob. 2.131ECh. 2 - Prob. 2.132ECh. 2 - Prob. 2.133ECh. 2 - Prob. 2.134ECh. 2 - Prob. 2.135ECh. 2 - Explain why women’s heights are likely to have a...Ch. 2 - Prob. 2.137ECh. 2 - Use the pennstate 1 dataset on the companion...
Knowledge Booster


Learn more about
Need a deep-dive on the concept behind this application? Look no further. Learn more about this topic, statistics and related others by exploring similar questions and additional content below.Similar questions
- Question: A company launches two different marketing campaigns to promote the same product in two different regions. After one month, the company collects the sales data (in units sold) from both regions to compare the effectiveness of the campaigns. The company wants to determine whether there is a significant difference in the mean sales between the two regions. Perform a two sample T-test You can provide your answer by inserting a text box and the answer must include: Null hypothesis, Alternative hypothesis, Show answer (output table/summary table), and Conclusion based on the P value. (2 points = 0.5 x 4 Answers) Each of these is worth 0.5 points. However, showing the calculation is must. If calculation is missing, the whole answer won't get any credit.arrow_forwardBinomial Prob. Question: A new teaching method claims to improve student engagement. A survey reveals that 60% of students find this method engaging. If 15 students are randomly selected, what is the probability that: a) Exactly 9 students find the method engaging?b) At least 7 students find the method engaging? (2 points = 1 x 2 answers) Provide answers in the yellow cellsarrow_forwardIn a survey of 2273 adults, 739 say they believe in UFOS. Construct a 95% confidence interval for the population proportion of adults who believe in UFOs. A 95% confidence interval for the population proportion is ( ☐, ☐ ). (Round to three decimal places as needed.)arrow_forward
- Find the minimum sample size n needed to estimate μ for the given values of c, σ, and E. C=0.98, σ 6.7, and E = 2 Assume that a preliminary sample has at least 30 members. n = (Round up to the nearest whole number.)arrow_forwardIn a survey of 2193 adults in a recent year, 1233 say they have made a New Year's resolution. Construct 90% and 95% confidence intervals for the population proportion. Interpret the results and compare the widths of the confidence intervals. The 90% confidence interval for the population proportion p is (Round to three decimal places as needed.) J.D) .arrow_forwardLet p be the population proportion for the following condition. Find the point estimates for p and q. In a survey of 1143 adults from country A, 317 said that they were not confident that the food they eat in country A is safe. The point estimate for p, p, is (Round to three decimal places as needed.) ...arrow_forward
- (c) Because logistic regression predicts probabilities of outcomes, observations used to build a logistic regression model need not be independent. A. false: all observations must be independent B. true C. false: only observations with the same outcome need to be independent I ANSWERED: A. false: all observations must be independent. (This was marked wrong but I have no idea why. Isn't this a basic assumption of logistic regression)arrow_forwardBusiness discussarrow_forwardSpam filters are built on principles similar to those used in logistic regression. We fit a probability that each message is spam or not spam. We have several variables for each email. Here are a few: to_multiple=1 if there are multiple recipients, winner=1 if the word 'winner' appears in the subject line, format=1 if the email is poorly formatted, re_subj=1 if "re" appears in the subject line. A logistic model was fit to a dataset with the following output: Estimate SE Z Pr(>|Z|) (Intercept) -0.8161 0.086 -9.4895 0 to_multiple -2.5651 0.3052 -8.4047 0 winner 1.5801 0.3156 5.0067 0 format -0.1528 0.1136 -1.3451 0.1786 re_subj -2.8401 0.363 -7.824 0 (a) Write down the model using the coefficients from the model fit.log_odds(spam) = -0.8161 + -2.5651 + to_multiple + 1.5801 winner + -0.1528 format + -2.8401 re_subj(b) Suppose we have an observation where to_multiple=0, winner=1, format=0, and re_subj=0. What is the predicted probability that this message is spam?…arrow_forward
- Consider an event X comprised of three outcomes whose probabilities are 9/18, 1/18,and 6/18. Compute the probability of the complement of the event. Question content area bottom Part 1 A.1/2 B.2/18 C.16/18 D.16/3arrow_forwardJohn and Mike were offered mints. What is the probability that at least John or Mike would respond favorably? (Hint: Use the classical definition.) Question content area bottom Part 1 A.1/2 B.3/4 C.1/8 D.3/8arrow_forwardThe details of the clock sales at a supermarket for the past 6 weeks are shown in the table below. The time series appears to be relatively stable, without trend, seasonal, or cyclical effects. The simple moving average value of k is set at 2. What is the simple moving average root mean square error? Round to two decimal places. Week Units sold 1 88 2 44 3 54 4 65 5 72 6 85 Question content area bottom Part 1 A. 207.13 B. 20.12 C. 14.39 D. 0.21arrow_forward
arrow_back_ios
SEE MORE QUESTIONS
arrow_forward_ios
Recommended textbooks for you
 Glencoe Algebra 1, Student Edition, 9780079039897...AlgebraISBN:9780079039897Author:CarterPublisher:McGraw Hill
 Functions and Change: A Modeling Approach to Coll...AlgebraISBN:9781337111348Author:Bruce Crauder, Benny Evans, Alan NoellPublisher:Cengage Learning
 Holt Mcdougal Larson Pre-algebra: Student Edition...AlgebraISBN:9780547587776Author:HOLT MCDOUGALPublisher:HOLT MCDOUGAL
Glencoe Algebra 1, Student Edition, 9780079039897...
Algebra
ISBN:9780079039897
Author:Carter
Publisher:McGraw Hill
Functions and Change: A Modeling Approach to Coll...
Algebra
ISBN:9781337111348
Author:Bruce Crauder, Benny Evans, Alan Noell
Publisher:Cengage Learning
Holt Mcdougal Larson Pre-algebra: Student Edition...
Algebra
ISBN:9780547587776
Author:HOLT MCDOUGAL
Publisher:HOLT MCDOUGAL
The Shape of Data: Distributions: Crash Course Statistics #7; Author: CrashCourse;https://www.youtube.com/watch?v=bPFNxD3Yg6U;License: Standard YouTube License, CC-BY
Shape, Center, and Spread - Module 20.2 (Part 1); Author: Mrmathblog;https://www.youtube.com/watch?v=COaid7O_Gag;License: Standard YouTube License, CC-BY
Shape, Center and Spread; Author: Emily Murdock;https://www.youtube.com/watch?v=_YyW0DSCzpM;License: Standard Youtube License