![MindTap Engineering for Das/Sobhan's Principles of Geotechnical Engineering, SI Edition, 9th Edition, [Instant Access], 2 terms (12 months)](https://s3.amazonaws.com/compass-isbn-assets/textbook_empty_images/large_textbook_empty.svg)
Videos
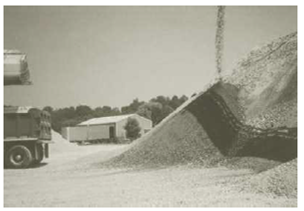
Three groups of students from the
(a)
(b)
Figure 2.35 (a) Soil-aggregate stockpile; (b) sieve analysis (Courtesy of Khaled Sobhan, Florida Atlantic University, Boca Raton, Florida)
a. Determine the coefficient of uniformity and the coefficient of gradation for Soils A, B, and C.
b. Which one is coarser: Soil A or Soil C? Justify your answer.
c. Although the soils are obtained from the same stockpile, why are the curves so different? (Hint: Comment on particle segregation and representative field sampling.)
d. Determine the percentages of gravel, sand and fines according to Unified Soil Classification System.
(a)
Calculate the coefficient of uniformity
Answer to Problem 2.1CTP
The uniformity coefficient of soil A is
The coefficient of gradation of soil A is
The uniformity coefficient of soil B is
The coefficient of gradation of soil B is
The uniformity coefficient of soil C is
The coefficient of gradation of soil C is
Explanation of Solution
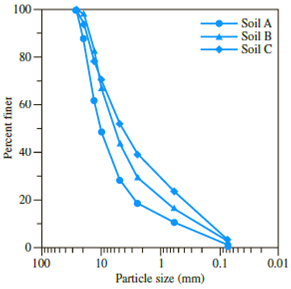
Sketch the grain size distribution curve for soils A, B, and C as shown in Figure 1.
![MindTap Engineering for Das/Sobhan's Principles of Geotechnical Engineering, SI Edition, 9th Edition, [Instant Access], 2 terms (12 months), Chapter 2, Problem 2.1CTP](https://content.bartleby.com/tbms-images/9781305970939/Chapter-2/images/70939-2-2.1ctp_image001.jpg)
Refer to Figure 1.
For soil A:
The diameter of the particle corresponding to
The diameter of the particle corresponding to
The diameter of the particle corresponding to
For soil B:
The diameter of the particle corresponding to
The diameter of the particle corresponding to
The diameter of the particle corresponding to
For soil C:
The diameter of the particle corresponding to
The diameter of the particle corresponding to
The diameter of the particle corresponding to
Calculate the uniformity coefficient
For soil A:
Substitute
Hence, the uniformity coefficient for soil A is
For soil B:
Substitute
Hence, the uniformity coefficient for soil B is
For soil C:
Substitute
Hence, the uniformity coefficient for soil C is
Calculate the coefficient of gradation
For soil A:
Substitute
Hence, the coefficient of gradation for soil A is
For soil B:
Substitute
Hence, the coefficient of gradation for soil B is
For soil C:
Substitute
Therefore, the coefficient of gradation for soil C is
(b)
State which of the soil is coarser from soil A and C.
Answer to Problem 2.1CTP
Soil A is coarser than soil C.
Explanation of Solution
Refer to part (a).
The uniformity coefficient of soil A is
The uniformity coefficient of soil C is
The percent of soil finer than
The percent of soil finer than
Hence, a higher percentage of soil C is finer than soil A.
Hence, soil A is coarser than soil C.
(c)
Explain the reason for curve different of soil A, B and C if it is obtained from same stockpile.
Explanation of Solution
The particle-size distribution curve shows the range of particle sizes present in a soil and the type of distribution of various-size particles.
Refer to Figure 1.
Particle separation of coarser and finer particles may take place in aggregate stockpiles. This makes representative sampling difficult.
Therefore, the particle-size distribution curve is different for soils A, B, and C.
(d)
Calculate the percentages of gravel, sand, and fines according to the Unified Soil Classification System.
Answer to Problem 2.1CTP
The percentage of gravel for soil A is
The percentage of sand for soil A is
The percentage of fines for soil A is
The percentage of gravel for soil B is
The percentage of sand for soil B is
The percentage of fines for soil B is
The percentage of gravel for soil C is
The percentage of sand for soil C is
The percentage of fines for soil C is
Explanation of Solution
Refer to Figure 1.
For soil A.
The percent passing through
The percent passing through
Calculate the percentage of gravel as shown below.
Hence, the percentage of gravel is
Calculate the percentage of sand as shown below.
Hence, the percentage of sand is
Calculate the percentage of fines as shown below.
Hence, the percentage of fines is
Refer to Figure 1.
For soil B.
The percent passing through
The percent passing through
Calculate the percentage of gravel as shown below.
Hence, the percentage of gravel is
Calculate the percentage of sand as shown below.
Hence, the percentage of sand is
Calculate the percentage of fines as shown below.
Hence, the percentage of fines is
Refer to Figure 1.
For soil C.
The percent passing through
The percent passing through
Calculate the percentage of gravel as shown below.
Hence, the percentage of gravel is
Calculate the percentage of sand as shown below.
Hence, the percentage of sand is
Calculate the percentage of fines as shown below.
Hence, the percentage of fines is
Want to see more full solutions like this?
Chapter 2 Solutions
MindTap Engineering for Das/Sobhan's Principles of Geotechnical Engineering, SI Edition, 9th Edition, [Instant Access], 2 terms (12 months)


- Problem 2 (Using force method) Determine the force in each member of the truss. E = 29000 ksi 3 k 1.5 in² 4 ft 1.5 in² 1.5 in² 2 in² 6 k D 1.5 in² 3 ft 2 in² Barrow_forwardThe single degree of freedom (SDOF) system that you studied under free vibration in Assignment #3 - Laboratory Component has been subjected to a strong ground motion. The acceleration at the base (excitation) and the acceleration at the roof (response) of the SDOF system was recorded with sampling rate 50 Hz (50 samples per second, or dt= 0.02 seconds). The file ElCentro.txt includes the two columns of acceleration data. The first column lists the acceleration at the base of the SDOF system. The second column lists the acceleration at the roof of the SDOF system. (a) Plot the time histories of the recorded accelerations at the base and at the roof of the SDOF system. (b) Compute the acceleration, velocity and displacement time histories of the roof of the SDOF system subjected to the recorded base acceleration using the Central Difference method. Plot the accel- eration, velocity and displacement time histories. Plot the restoring force, the damping force, and the inertia force time…arrow_forwardPlease explain step by step and show formulaarrow_forward
- Please explain step by step and show formulaarrow_forwardFor an reinforced concrete two-way slab shown in figure under the load (P). (the slab continuous over all edges - all sides are fixed), Determine (By using yield line theory): A- Draw the Yield line Pattern B- Determine the moment m 3BAT C- Find The required flexural steel to resist the loads causing the slab to collapse if P = 200 KN, fc = 28 MPa, fy = 420 MPa d = 120 mm. Use 10 mm bars. (Pmin = 0.002) 6m 8m >2m->) 3marrow_forward3BAT For an reinforced concrete two-way slab shown in figure under the load (P). (the slab continuous over all edges - all sides are fixed), Determine (By using yield line theory): A- Draw the Yield line Pattern B- Determine the moment m KN, fc Please don't solve in Al anco if P = 200 6m 8m 2m-)) 3marrow_forward
- Please explain step by step and show formulaarrow_forwardPlease explain step by step and show formulaarrow_forward4-You are making a bookshelf (shown below) to carry books that range from 8½" to 11" in height and would take up 29" of space along the length. The material is wood having a Young's Modulus of 3.66 ksi, thickness of 3/8", and width of 12". You want to find the maximum vertical deflection of the bookshelf. The vertical deflection of the shelf is given by: -0.67665 x10 8x4 -0.26689x105 x3 +0.12748x10³ x² -0.018057=0 x Bookshelf Booksarrow_forward
- The difference in water surface levels in two tanks, which are connected by three pipes in series of lengths 300 m, 170 m, and 210 m, having diameters 300 mm, 200 mm, and 400 mm, respectively, is 12 m. Determine the rate of flow of water if coefficients of friction are 0.005, 0.0052, and 0.0048, respectively. Determine the discharge and velocity in each pipe, considering the minor losses and neglecting minor losses.arrow_forward3 BAT For an reinforced concrete two-way slab shown in figure under the load (P). (the slab continuous over all edges - all sides are fixed), Determine (By using yield line theory): A- Draw the Yield line Pattern B- Determine the moment m C- Find The required flexural steel to resist the loads causing the slab to collapse if P = 200 KN, f=28 MPa, fy = 420 MPa d = 120 mm. Use 10 mm bars. (Pmin = 0.002) 6m 8m >2m-)) 3marrow_forwardREINFORCED CONCRETE DESIGNANALYSIS OF SINGLY REINFORCED BEAMS (STRENGTH DESIGN METHOD)Direction:Solution must be completeUse ballpen/inkpenAnswer in two decimal placesBox your final answerarrow_forward
 Principles of Geotechnical Engineering (MindTap C...Civil EngineeringISBN:9781305970939Author:Braja M. Das, Khaled SobhanPublisher:Cengage Learning
 Traffic and Highway EngineeringCivil EngineeringISBN:9781305156241Author:Garber, Nicholas J.Publisher:Cengage Learning
 Fundamentals of Geotechnical Engineering (MindTap...Civil EngineeringISBN:9781305635180Author:Braja M. Das, Nagaratnam SivakuganPublisher:Cengage Learning
 Construction Materials, Methods and Techniques (M...Civil EngineeringISBN:9781305086272Author:William P. Spence, Eva KultermannPublisher:Cengage Learning
 Principles of Foundation Engineering (MindTap Cou...Civil EngineeringISBN:9781337705028Author:Braja M. Das, Nagaratnam SivakuganPublisher:Cengage Learning