(a)
Identify the role of scarcity on
(a)
Explanation of Solution
Figure 1 illustrates the PPF of Company B.
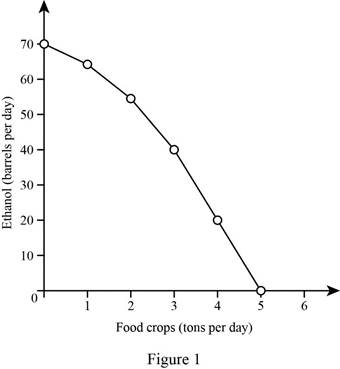
In Figure 1, the x-axis shows food crops and the y-axis shows ethanol. The PPF shows the production combinations of ethanol and food crops. The production combinations of these commodities lie beyond the PPF and are not attainable with the given resources; this indicates the concept of scarcity. The movement along the PPF also indicates scarcity because when one good produces more, other goods are reduced.
Scarcity: Scarcity refers to the limited availability of resources than the required level.
Production possibility frontier: Production possibility frontier shows the boundary between the combination of two goods and services that can produced at the given level of resources.
(b)
Identify the concept of production efficiency.
(b)
Explanation of Solution
A production possibility frontier shows the combination of two commodities that can be produced at the given level of resources. Therefore, the combinations of commodities that lie along the PPF indicate efficient production levels. In this case, if Company B produces 40 barrels of ethanol per day, then the production of food per day needed to achieve the production efficiency will be 3 tons.
Efficient production: Efficient production shows the combinations of two commodities that lie along the PPF.
(c)
Identify the concept of tradeoff in a PPF.
(c)
Explanation of Solution
A movement along the PPF curve explains that producing more of one good leads to producing less of another good. Therefore, there is a tradeoff that exists between the commodities; it is also noted that this type of tradeoff exists only at an efficient production level. In this case, Company B has limited resources and technology. Therefore, an increase in the production of one good decreases the production of the other good. As a result, Company B will face a tradeoff on its PPF.
Production possibility frontier: Production possibility frontier shows the boundary between the combination of two goods and services that can be produced at the given level of resources.
Want to see more full solutions like this?
Chapter 2 Solutions
Microeconomics, Student Value Edition Plus MyLab Economics with Pearson eText - Access Card Package (12th Edition)

- You are the manager of a large automobile dealership who wants to learn more about the effective- ness of various discounts offered to customers over the past 14 months. Following are the average negotiated prices for each month and the quantities sold of a basic model (adjusted for various options) over this period of time. 1. Graph this information on a scatter plot. Estimate the demand equation. What do the regression results indicate about the desirability of discounting the price? Explain. Month Price Quantity Jan. 12,500 15 Feb. 12,200 17 Mar. 11,900 16 Apr. 12,000 18 May 11,800 20 June 12,500 18 July 11,700 22 Aug. 12,100 15 Sept. 11,400 22 Oct. 11,400 25 Nov. 11,200 24 Dec. 11,000 30 Jan. 10,800 25 Feb. 10,000 28 2. What other factors besides price might be included in this equation? Do you foresee any difficulty in obtaining these additional data or incorporating them in the regression analysis?arrow_forwardsimple steps on how it should look like on excelarrow_forwardConsider options on a stock that does not pay dividends.The stock price is $100 per share, and the risk-free interest rate is 10%.Thestock moves randomly with u=1.25and d=1/u Use Excel to calculate the premium of a10-year call with a strike of $100.arrow_forward
- Please solve this, no words or explanations.arrow_forward17. Given that C=$700+0.8Y, I=$300, G=$600, what is Y if Y=C+I+G?arrow_forwardUse the Feynman technique throughout. Assume that you’re explaining the answer to someone who doesn’t know the topic at all. Write explanation in paragraphs and if you use currency use USD currency: 10. What is the mechanism or process that allows the expenditure multiplier to “work” in theKeynesian Cross Model? Explain and show both mathematically and graphically. What isthe underpinning assumption for the process to transpire?arrow_forward
- Use the Feynman technique throughout. Assume that you’reexplaining the answer to someone who doesn’t know the topic at all. Write it all in paragraphs: 2. Give an overview of the equation of exchange (EoE) as used by Classical Theory. Now,carefully explain each variable in the EoE. What is meant by the “quantity theory of money”and how is it different from or the same as the equation of exchange?arrow_forwardZbsbwhjw8272:shbwhahwh Zbsbwhjw8272:shbwhahwh Zbsbwhjw8272:shbwhahwhZbsbwhjw8272:shbwhahwhZbsbwhjw8272:shbwhahwharrow_forwardUse the Feynman technique throughout. Assume that you’re explaining the answer to someone who doesn’t know the topic at all:arrow_forward

 Essentials of Economics (MindTap Course List)EconomicsISBN:9781337091992Author:N. Gregory MankiwPublisher:Cengage Learning
 Brief Principles of Macroeconomics (MindTap Cours...EconomicsISBN:9781337091985Author:N. Gregory MankiwPublisher:Cengage Learning
 Principles of Economics 2eEconomicsISBN:9781947172364Author:Steven A. Greenlaw; David ShapiroPublisher:OpenStax
 Principles of Macroeconomics (MindTap Course List)EconomicsISBN:9781305971509Author:N. Gregory MankiwPublisher:Cengage Learning