
(a)
Identify the role of scarcity on
(a)
Explanation of Solution
Figure 1 illustrates the PPF of Company B.
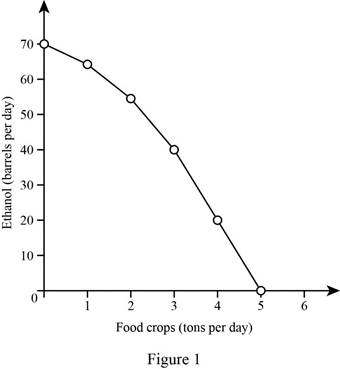
In Figure 1, the x-axis shows food crops and the y-axis shows ethanol. The PPF shows the production combinations of ethanol and food crops. The production combinations of these commodities lie beyond the PPF and are not attainable with the given resources; this indicates the concept of scarcity. The movement along the PPF also indicates scarcity because when one good produces more, other goods are reduced.
Scarcity: Scarcity refers to the limited availability of resources than the required level.
Production possibility frontier: Production possibility frontier shows the boundary between the combination of two goods and services that can produced at the given level of resources.
(b)
Identify the concept of production efficiency.
(b)
Explanation of Solution
A production possibility frontier shows the combination of two commodities that can be produced at the given level of resources. Therefore, the combinations of commodities that lie along the PPF indicate efficient production levels. In this case, if Company B produces 40 barrels of ethanol per day, then the production of food per day needed to achieve the production efficiency will be 3 tons.
Efficient production: Efficient production shows the combinations of two commodities that lie along the PPF.
(c)
Identify the concept of tradeoff in a PPF.
(c)
Explanation of Solution
A movement along the PPF curve explains that producing more of one good leads to producing less of another good. Therefore, there is a tradeoff that exists between the commodities; it is also noted that this type of tradeoff exists only at an efficient production level. In this case, Company B has limited resources and technology. Therefore, an increase in the production of one good decreases the production of the other good. As a result, Company B will face a tradeoff on its PPF.
Production possibility frontier: Production possibility frontier shows the boundary between the combination of two goods and services that can be produced at the given level of resources.
Want to see more full solutions like this?
Chapter 2 Solutions
EBK MACROECONOMICS

- 17. Given that C=$700+0.8Y, I=$300, G=$600, what is Y if Y=C+I+G?arrow_forwardUse the Feynman technique throughout. Assume that you’re explaining the answer to someone who doesn’t know the topic at all. Write explanation in paragraphs and if you use currency use USD currency: 10. What is the mechanism or process that allows the expenditure multiplier to “work” in theKeynesian Cross Model? Explain and show both mathematically and graphically. What isthe underpinning assumption for the process to transpire?arrow_forwardUse the Feynman technique throughout. Assume that you’reexplaining the answer to someone who doesn’t know the topic at all. Write it all in paragraphs: 2. Give an overview of the equation of exchange (EoE) as used by Classical Theory. Now,carefully explain each variable in the EoE. What is meant by the “quantity theory of money”and how is it different from or the same as the equation of exchange?arrow_forward
- Zbsbwhjw8272:shbwhahwh Zbsbwhjw8272:shbwhahwh Zbsbwhjw8272:shbwhahwhZbsbwhjw8272:shbwhahwhZbsbwhjw8272:shbwhahwharrow_forwardUse the Feynman technique throughout. Assume that you’re explaining the answer to someone who doesn’t know the topic at all:arrow_forwardUse the Feynman technique throughout. Assume that you’reexplaining the answer to someone who doesn’t know the topic at all: 4. Draw a Keynesian AD curve in P – Y space and list the shift factors that will shift theKeynesian AD curve upward and to the right. Draw a separate Classical AD curve in P – Yspace and list the shift factors that will shift the Classical AD curve upward and to the right.arrow_forward
- Use the Feynman technique throughout. Assume that you’re explaining the answer to someone who doesn’t know the topic at all: 10. What is the mechanism or process that allows the expenditure multiplier to “work” in theKeynesian Cross Model? Explain and show both mathematically and graphically. What isthe underpinning assumption for the process to transpire?arrow_forwardUse the Feynman technique throughout. Assume that you’re explaining the answer to someone who doesn’t know the topic at all: 15. How is the Keynesian expenditure multiplier implicit in the Keynesian version of the AD/ASmodel? Explain and show mathematically. (note: this is a tough one)arrow_forwardUse the Feynman technique throughout. Assume that you’re explaining the answer to someone who doesn’t know the topic at all: 13. What would happen to the net exports function in Europe and the US respectively if thedemand for dollars rises worldwide? Explain why.arrow_forward

 Essentials of Economics (MindTap Course List)EconomicsISBN:9781337091992Author:N. Gregory MankiwPublisher:Cengage Learning
 Brief Principles of Macroeconomics (MindTap Cours...EconomicsISBN:9781337091985Author:N. Gregory MankiwPublisher:Cengage Learning
 Principles of Economics 2eEconomicsISBN:9781947172364Author:Steven A. Greenlaw; David ShapiroPublisher:OpenStax
 Principles of Macroeconomics (MindTap Course List)EconomicsISBN:9781305971509Author:N. Gregory MankiwPublisher:Cengage Learning