Concept explainers
Videos
In Problem 1-3:
Determine the slope and y-intercept of each linear function.
Graph each function. Label the intercepts.
Determine the domain and the range of each function.
Determine the average rate of change of each function.
Determine whether the function is increasing, decreasing of constant.
(a)
The slope and y-intercept of the linear function
Explanation of Solution
Given information:
The linear function is
Explanation:
Let us consider the function,
Compare the given function
Hence, the slope
(b)
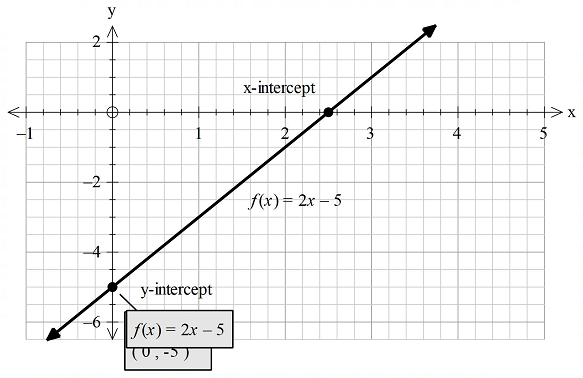
To graph: The function
Explanation of Solution
Given information:
The linear function is
Graph:
Graph the function
Solve the equation
Now, add 5 on both sides below in value.
Divide 2 on both sides below in value.
Therefore, the x-intercept is
Then, the graph of the function
At first mark the x-intercept and y-intercepts on the axes and then join them with a straight edge
as shown in the following diagram.
(c)
The domain and the range of thefunction
Explanation of Solution
Given information:
The given function is
Explanation:
Find the domain and range of the given function
Observe the above diagram, in which the function
The graph a along both sides of the x-axis without gaps, it means the domain of the given function is all real numbers.
Therefore the domain of the function
And also observed that, the graph is along both sides of the y-asix without gaps, it
Since, the range of the function
Hence, the function f is decreasing.
(d)
The average rate of change of the given function
Explanation of Solution
Given information:
The given function is
Explanation:
Calculate the average rate of the functions
The average rate of the function
The average rate of a linear function is its slope: therefore the average rate of the function
(e)
Whether the function is
Explanation of Solution
Given information:
The given function is
Explanation:
Determine whether the function is increasing, decreasing or constant.
Write the fact that, a linear function with positive slope is always an increasing function:
Apply the fact to check the behavior of the graph of the given function.
Therefore the given function
Hence, the function
Want to see more full solutions like this?
Chapter 2 Solutions
Pearson eText for Precalculus: Concepts Through Functions, A Right Triangle Approach to Trigonometry -- Instant Access (Pearson+)


- Determine whether the lines L₁ : F(t) = (−2, 3, −1)t + (0,2,-3) and L2 : ƒ(s) = (2, −3, 1)s + (−10, 17, -8) intersect. If they do, find the point of intersection. ● They intersect at the point They are skew lines They are parallel or equalarrow_forwardAnswer questions 2arrow_forwardHow does a fourier transform works?arrow_forward
- Determine the radius of convergence of a power series:12.6.5, 12.6.6, 12.6.7, 12.6.8Hint: Use Theorem12.5.1 and root test, ratio test, integral testarrow_forwardCan you answer this question and give step by step and why and how to get it. Can you write it (numerical method)arrow_forwardCan you answer this question and give step by step and why and how to get it. Can you write it (numerical method)arrow_forward
- There are three options for investing $1150. The first earns 10% compounded annually, the second earns 10% compounded quarterly, and the third earns 10% compounded continuously. Find equations that model each investment growth and use a graphing utility to graph each model in the same viewing window over a 20-year period. Use the graph to determine which investment yields the highest return after 20 years. What are the differences in earnings among the three investment? STEP 1: The formula for compound interest is A = nt = P(1 + − − ) n², where n is the number of compoundings per year, t is the number of years, r is the interest rate, P is the principal, and A is the amount (balance) after t years. For continuous compounding, the formula reduces to A = Pert Find r and n for each model, and use these values to write A in terms of t for each case. Annual Model r=0.10 A = Y(t) = 1150 (1.10)* n = 1 Quarterly Model r = 0.10 n = 4 A = Q(t) = 1150(1.025) 4t Continuous Model r=0.10 A = C(t) =…arrow_forwardUse a graphing utility to find the point of intersection, if any, of the graphs of the functions. Round your result to three decimal places. (Enter NONE in any unused answer blanks.) y = 100e0.01x (x, y) = y = 11,250 ×arrow_forward5. For the function y-x³-3x²-1, use derivatives to: (a) determine the intervals of increase and decrease. (b) determine the local (relative) maxima and minima. (e) determine the intervals of concavity. (d) determine the points of inflection. (e) sketch the graph with the above information indicated on the graph.arrow_forward
- Can you solve this 2 question numerical methodarrow_forward1. Estimate the area under the graph of f(x)-25-x from x=0 to x=5 using 5 approximating rectangles Using: (A) right endpoints. (B) left endpoints.arrow_forward9. Use fundamental theorem of calculus to find the derivative d a) *dt sin(x) b)(x)√1-2 dtarrow_forward
 Holt Mcdougal Larson Pre-algebra: Student Edition...AlgebraISBN:9780547587776Author:HOLT MCDOUGALPublisher:HOLT MCDOUGAL
 Algebra: Structure And Method, Book 1AlgebraISBN:9780395977224Author:Richard G. Brown, Mary P. Dolciani, Robert H. Sorgenfrey, William L. ColePublisher:McDougal Littell
 Glencoe Algebra 1, Student Edition, 9780079039897...AlgebraISBN:9780079039897Author:CarterPublisher:McGraw Hill
 College AlgebraAlgebraISBN:9781305115545Author:James Stewart, Lothar Redlin, Saleem WatsonPublisher:Cengage Learning
 Algebra and Trigonometry (MindTap Course List)AlgebraISBN:9781305071742Author:James Stewart, Lothar Redlin, Saleem WatsonPublisher:Cengage Learning
 Functions and Change: A Modeling Approach to Coll...AlgebraISBN:9781337111348Author:Bruce Crauder, Benny Evans, Alan NoellPublisher:Cengage Learning