Concept explainers
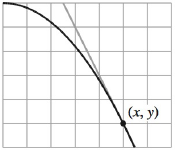
Approximating the Slope of a Graph In Exercises 1-4, approximate the slope of the graph at the point (x, y). (Each square on the grid is 1 unit by 1 unit.)

To calculate: The slope of the provided graph at the given point
The provided graph is shown below,

Answer to Problem 1RE
Solution:
The slope of the given curve at point
Explanation of Solution
Given Information:
The provided graph is shown below,

Each grid in the curve represents 1 unit by 1 unit as dimensions
Formula used:
Consider the equation of the given curve as
Here
Calculation:
The change in y is 4 units decreasing for 2 unit increase in x direction.
Hence, using formula for the slope of a function,
Here
The slope of the given graph is,
Now, as there is a decrease of 2 units in y as per increase in a unit of x
Therefore, the slope at point
Want to see more full solutions like this?
Chapter 2 Solutions
Calculus: An Applied Approach (MindTap Course List)
- 4. Find the inverse Laplace Transform Show all of your work: a. F(s) = = 2s-3 (s²-10s+61)(5-3) se-2s b. G(s) = (s+2)²arrow_forward1. Consider the differential equation, show all of your work: dy =(y2)(y+1) dx a. Determine the equilibrium solutions for the differential equation. b. Where is the differential equation increasing or decreasing? c. Where are the changes in concavity? d. Suppose that y(0)=0, what is the value of y as t goes to infinity?arrow_forward2. Suppose a LC circuit has the following differential equation: q'+4q=6etcos 4t, q(0) = 1 a. Find the function for q(t), use any method that we have studied in the course. b. What is the transient and the steady-state of the circuit?arrow_forward
- 5. Use variation of parameters to find the general solution to the differential equation: y" - 6y' + 9y=e3x Inxarrow_forwardLet the region R be the area enclosed by the function f(x) = ln (x) + 2 and g(x) = x. Write an integral in terms of x and also an integral in terms of y that would represent the area of the region R. If necessary, round limit values to the nearest thousandth. 5 4 3 2 1 y x 1 2 3 4arrow_forward(28 points) Define T: [0,1] × [−,0] → R3 by T(y, 0) = (cos 0, y, sin 0). Let S be the half-cylinder surface traced out by T. (a) (4 points) Calculate the normal field for S determined by T.arrow_forward
- (14 points) Let S = {(x, y, z) | z = e−(x²+y²), x² + y² ≤ 1}. The surface is the graph of ze(+2) sitting over the unit disk. = (a) (4 points) What is the boundary OS? Explain briefly. (b) (4 points) Let F(x, y, z) = (e³+2 - 2y, xe³±² + y, e²+y). Calculate the curl V × F.arrow_forward(6 points) Let S be the surface z = 1 − x² - y², x² + y² ≤1. The boundary OS of S is the unit circle x² + y² = 1. Let F(x, y, z) = (x², y², z²). Use the Stokes' Theorem to calculate the line integral Hint: First calculate V x F. Jos F F.ds.arrow_forward(28 points) Define T: [0,1] × [−,0] → R3 by T(y, 0) = (cos 0, y, sin 0). Let S be the half-cylinder surface traced out by T. (a) (4 points) Calculate the normal field for S determined by T.arrow_forward
- I need the last answer t=? I did got the answer for the first two this is just homework.arrow_forward7) 8) Let R be the region bounded by the given curves as shown in the figure. If the line x = k divides R into two regions of equal area, find the value of k 7. y = 3√x, y = √x and x = 4 8. y = -2, y = 3, x = −3, and x = −1 -1 2 +1 R Rarrow_forwardSolve this question and show steps.arrow_forward
- Algebra & Trigonometry with Analytic GeometryAlgebraISBN:9781133382119Author:SwokowskiPublisher:Cengage
 Big Ideas Math A Bridge To Success Algebra 1: Stu...AlgebraISBN:9781680331141Author:HOUGHTON MIFFLIN HARCOURTPublisher:Houghton Mifflin Harcourt
 Holt Mcdougal Larson Pre-algebra: Student Edition...AlgebraISBN:9780547587776Author:HOLT MCDOUGALPublisher:HOLT MCDOUGAL


