
Concept explainers
Subpart (a):
Production possibilities frontier of Mexico and United States.
Subpart (a):
Explanation of Solution
The production possibilities frontier of Mexico and United States is shown in Figure 1 below:
Figure 1 shows the
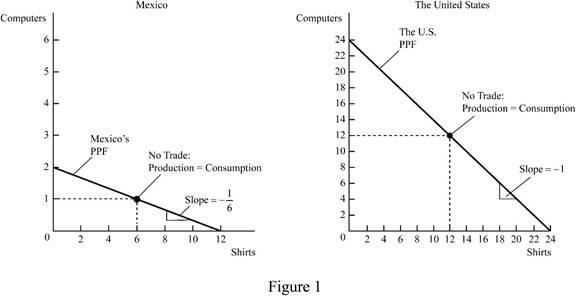
In Figure 1, the left side diagram shows PPF of Mexico and right side diagram shows the PPF of US. The vertical axis of both measures the number of computers produced by Mexico and United States, and the horizontal axis measures the number of shirts. Mexico produces 2 computers and 12 shirts, and United States produces 24 computers and 24 shirts.
Concept introduction:
Production possibilities frontier (PPF): PPF refers to the different combination of goods and services that can be produced efficiently with the given resources by a country. Any points inside the PPF represent inefficient usage of the resources, and any points outside the PPF represent that it is not attainable with the available resources.
Subpart (b):
Calculation of opportunity cost .
Subpart (b):
Explanation of Solution
The equation to calculate the opportunity cost is shown below.
Substitute the respective values in Equation (1) to calculate the opportunity cost of producing a shirt in Mexico.
Opportunity cost of producing a shirt in Mexico is 0.1666.
Substitute the respective values in Equation (1) to calculate the opportunity cost of producing a shirt in United States.
Opportunity cost of producing a shirt in United States is 1.
Mexico has to produce more number of shirts. This is because when comparing the opportunity cost of producing a shirt in both countries, Mexico has the lowest opportunity cost.
Concept introduction:
Opportunity cost: Opportunity cost refers to the value of forgone goods and services to consume the other goods and services.
Sub part (c):
Calculation of opportunity cost.
Sub part (c):
Explanation of Solution
Substitute the respective values in Equation (1) to calculate the opportunity cost of producing a computer in Mexico.
The opportunity cost of producing a computer in Mexico is 6.
Substitute the respective values in Equation (1) to calculate the opportunity cost of producing a computer in United States.
Opportunity cost of producing a computer in United States is 1.
United States has to produce more number of computers. This is because when comparing the opportunity of producing a computer in both countries, United States has the lowest opportunity cost.
Concept introduction:
Opportunity cost: Opportunity cost refers to the value of forgone goods and services to consume the other goods and services.
Sub part (d):
Production possibility frontier.
Sub part (d):
Explanation of Solution
On the basis of opportunity cost of producing a shirt and a computer in both countries, Mexico has a
Figure 2 shows the PPF of trade alliance between United States and Mexico.
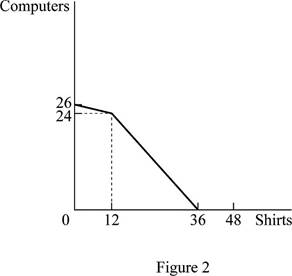
In Figure 2, the vertical axis measures the volume of production of computers and the horizontal axis measures the volume of production of shirts. United States produces 24 units of computer and Mexico produces 1 unit. In the case of shirt, Mexico produces 12 units and United States produces 24 units.
Concept introduction:
Production possibilities frontier (PPF): PPF refers to the different combination of goods and services that can be produced efficiently with the given resources by a country. Any points inside the PPF represent inefficient usage of the resources, and any points outside the PPF represent that it is not attainable with the available resources.
Sub part (e):
Production possibility frontier.
Sub part (e):
Explanation of Solution
The trade alliance after the entrance of Haiti is shown below:
Figure 3 shows the PPF of trade alliance of Haiti, Mexico, and United States.
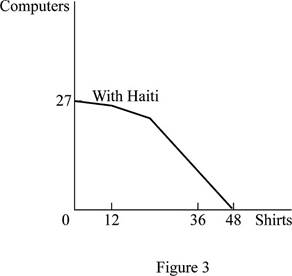
In Figure 3, the vertical axis measures the volume of production of computers and the horizontal axis measures the volume of production of shirts. This is the new PPF after the trade alliance of Haiti with the trade alliance between Mexico and United States. Haiti is producing 1 unit of computer and 12 units of shirt.
Concept introduction:
Production possibilities frontier (PPF): PPF refers to the different combination of goods and services that can be produced efficiently with the given resources by a country. Any points inside the PPF represent inefficient usage of the resources, and any points outside the PPF represent that it is not attainable with the available resources.
Sub part (f):
Production possibility frontier.
Sub part (f):
Explanation of Solution
The PPF of trade alliance of existing three countries and many countries who join the trade alliance is shown below.
Figure 4 shows the PPF for trade alliance between infinity numbers of countries.
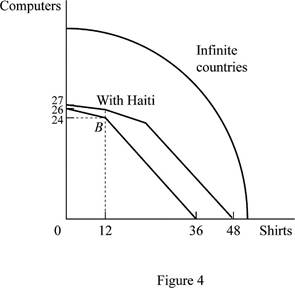
In Figure 4, the vertical axis measures the volume of production of computers and the horizontal axis measures the volume of production of shirts. The first curve represents that PPF is the trade alliance between Mexico and United States. The second curve represents that PPF is the trade alliance between Mexico, United States with Haiti. The third curve represents the PPF of trade alliance between infinity numbers of countries.
Concept introduction:
Production possibilities frontier (PPF): PPF refers to the different combination of goods and services that can be produced efficiently with the given resources by a country. Any points inside the PPF represent inefficient usage of the resources, and any points outside the PPF represent that it is not attainable with the available resources.
Want to see more full solutions like this?
Chapter 2 Solutions
EBK MODERN PRINCIPLES OF MICROECONOMICS


- In a paragraph, no bullet, points please answer the question and follow the instructions. Give only the solution: Use the Feynman technique throughout. Assume that you’re explaining the answer to someone who doesn’t know the topic at all. 8. How does monetary policy supposedly translate into changes in AD?arrow_forwardIn a paragraph, no bullet, points please answer the question and follow the instructions. Give only the solution: Use the Feynman technique throughout. Assume that you’re explaining the answer to someone who doesn’t know the topic at all. 2. Carefully explain either Keynes’ “cookie jar” motive for holding money or the “saw-toothed model’s” motive for holding a safety stock.arrow_forwardIn a paragraph, no bullet, points please answer the question and follow the instructions. Give only the solution: Use the Feynman technique throughout. Assume that you’re explaining the answer to someone who doesn’t know the topic at all. 7.Carefully explain the Fisher equation for interest rates. What insight does it provide?arrow_forward
- In a paragraph, no bullet, points please answer the question and follow the instructions. Give only the solution: Use the Feynman technique throughout. Assume that you’re explaining the answer to someone who doesn’t know the topic at all. 3. Describe the general architecture of the Federal Reserve System.arrow_forwardIn a paragraph, no bullet, points please answer the question and follow the instructions. Give only the solution: Use the Feynman technique throughout. Assume that you’re explaining the answer to someone who doesn’t know the topic at all. 1. Define money. Carefully explain the three functions of money.arrow_forwardIn a paragraph, no bullet, points please answer the question and follow the instructions. Give only the solution: Use the Feynman technique throughout. Assume that you’re explaining the answer to someone who doesn’t know the topic at all. 5.Draw the Federal Reserve System’s Balance Sheet and briefly explain each of the main (highlighted in the PowerPoints and text) components.arrow_forward
- In a paragraph, no bullet, points please answer the question and follow the instructions. Give only the solution: Use the Feynman technique throughout. Assume that you’re explaining the answer to someone who doesn’t know the topic at all. 9. What are monetary rules? How are they carried out and what is the difference between monetary rules and discretionary behavior?arrow_forwardIn a paragraph, no bullet, points please answer the question and follow the instructions. Give only the solution: Use the Feynman technique throughout. Assume that you’re explaining the answer to someone who doesn’t know the topic at all. 4. What is interest payment on reserve balances used for? How does it work?arrow_forwardA linear programming computer package is needed. As part of the settlement for a class action lawsuit, Hoxworth Corporation must provide sufficient cash to make the following annual payments (in thousands of dollars). Year 1 2 3 4 5 6 Payment 170 195 220 265 295 440 The annual payments must be made at the beginning of each year. The judge will approve an amount that, along with earnings on its investment, will cover the annual payments. Investment of the funds will be limited to savings (at 4% annually) and government securities, at prices and rates currently quoted in The Wall Street Journal. Hoxworth wants to develop a plan for making the annual payments by investing in the following securities (par value = $1,000). Funds not invested in these securities will be placed in savings. Security Current Price Rate (%) Years to Maturity 1 $1,055 6.750 3 2 $1,000 5.125 4 Assume that interest is paid annually. The plan will be submitted to the judge and, if approved,…arrow_forward
- On the 1st of April 2018, the South African National Treasury increase the value-added tax rate from 14% to 15%. This policy change had a wide-ranging impact on society. Discuss some of the benefits and drawbacks of making use of this type of tax to generate government revenue and what we may expect in terms of its impact on inflation and GDP growth within the economy. Please use some of the economics graphs to explain some scenariosarrow_forwardEskom is South Africa’s monopoly power producer which the majority of South Africans depend on. Suppose there is extensive deregulation in the power industry. What is the impact of this deregulation on the industry? Help me on discussing the new market structure as well as the impact on supply and demand. Use the relevant diagrams.arrow_forwardDiscuss the impact of exchange rate volatility on the economy and its impact on your organisation. Make use of the relevant diagrams.arrow_forward

 Principles of Economics (12th Edition)EconomicsISBN:9780134078779Author:Karl E. Case, Ray C. Fair, Sharon E. OsterPublisher:PEARSON
 Engineering Economy (17th Edition)EconomicsISBN:9780134870069Author:William G. Sullivan, Elin M. Wicks, C. Patrick KoellingPublisher:PEARSON
 Principles of Economics (MindTap Course List)EconomicsISBN:9781305585126Author:N. Gregory MankiwPublisher:Cengage Learning
 Managerial Economics: A Problem Solving ApproachEconomicsISBN:9781337106665Author:Luke M. Froeb, Brian T. McCann, Michael R. Ward, Mike ShorPublisher:Cengage Learning
 Managerial Economics & Business Strategy (Mcgraw-...EconomicsISBN:9781259290619Author:Michael Baye, Jeff PrincePublisher:McGraw-Hill Education