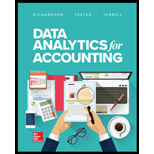
Data Analytics For Accounting
19th Edition
ISBN: 9781260375183
Author: RICHARDSON
Publisher: MCG
expand_more
expand_more
format_list_bulleted
Question
Chapter 2, Problem 10DQ
a.
To determine
Identify the effect of transforming NULL and N/A values into blanks.
b.
To determine
Identify the effect of transforming NULL and N/A values into zeroes.
c.
To determine
Identify the effect of deleting records that have NULL and N/A values from your dataset.
Expert Solution & Answer
Trending nowThis is a popular solution!

Students have asked these similar questions
Assume that retained earnings increased by $78,420 from March 31 of year 1 to March 31 of year 2. A cash dividend of $19,700 was declared and paid during the year. Compute the net income for the year. need help
Green Valley Manufacturing has sales of $750,000, variable
costs of $450,000, and fixed costs of $200,000. What is the
contribution margin ratio?
Please provide the answer to this general accounting question using the right approach.
Chapter 2 Solutions
Data Analytics For Accounting
Ch. 2 - Prob. 1MCQCh. 2 - Prob. 2MCQCh. 2 - Prob. 3MCQCh. 2 - Prob. 4MCQCh. 2 - Prob. 5MCQCh. 2 - Prob. 6MCQCh. 2 - Prob. 7MCQCh. 2 - Prob. 8MCQCh. 2 - Prob. 9MCQCh. 2 - Prob. 10MCQ
Ch. 2 - Prob. 1DQCh. 2 - Prob. 2DQCh. 2 - Prob. 3DQCh. 2 - Prob. 4DQCh. 2 - Prob. 5DQCh. 2 - Prob. 6DQCh. 2 - Prob. 7DQCh. 2 - Prob. 8DQCh. 2 - Prob. 9DQCh. 2 - Prob. 10DQCh. 2 - Prob. 1PCh. 2 - Prob. 2PCh. 2 - Prob. 3PCh. 2 - Which attributes from the College Scorecard data...Ch. 2 - Prob. 5PCh. 2 - Which attributes from the College Scorecard data...Ch. 2 - Use the College Scorecard data to determine if...Ch. 2 - Prob. 8PCh. 2 - Prob. 9P
Knowledge Booster
Similar questions
- Please explain the correct approach for solving this general accounting question.arrow_forwardDuring 2022, the assets of Incredible Heights increased by $60,000, and the liabilities increased by $18,000. If the owner's equity in Incredible Heights is $130,000 at the end of2022, the owner's equity at the beginning of 2022 must have been __.arrow_forwardSUBJECT: FINANCIAL ACCOUNTINGarrow_forward
arrow_back_ios
SEE MORE QUESTIONS
arrow_forward_ios
Recommended textbooks for you
 Auditing: A Risk Based-Approach to Conducting a Q...AccountingISBN:9781305080577Author:Karla M Johnstone, Audrey A. Gramling, Larry E. RittenbergPublisher:South-Western College Pub
 Fundamentals Of Financial Management, Concise Edi...FinanceISBN:9781337902571Author:Eugene F. Brigham, Joel F. HoustonPublisher:Cengage Learning
 Fundamentals of Financial Management, Concise Edi...FinanceISBN:9781285065137Author:Eugene F. Brigham, Joel F. HoustonPublisher:Cengage Learning
 Fundamentals of Financial Management, Concise Edi...FinanceISBN:9781305635937Author:Eugene F. Brigham, Joel F. HoustonPublisher:Cengage Learning
 Essentials of Business Analytics (MindTap Course ...StatisticsISBN:9781305627734Author:Jeffrey D. Camm, James J. Cochran, Michael J. Fry, Jeffrey W. Ohlmann, David R. AndersonPublisher:Cengage Learning

Auditing: A Risk Based-Approach to Conducting a Q...
Accounting
ISBN:9781305080577
Author:Karla M Johnstone, Audrey A. Gramling, Larry E. Rittenberg
Publisher:South-Western College Pub


Fundamentals Of Financial Management, Concise Edi...
Finance
ISBN:9781337902571
Author:Eugene F. Brigham, Joel F. Houston
Publisher:Cengage Learning

Fundamentals of Financial Management, Concise Edi...
Finance
ISBN:9781285065137
Author:Eugene F. Brigham, Joel F. Houston
Publisher:Cengage Learning

Fundamentals of Financial Management, Concise Edi...
Finance
ISBN:9781305635937
Author:Eugene F. Brigham, Joel F. Houston
Publisher:Cengage Learning

Essentials of Business Analytics (MindTap Course ...
Statistics
ISBN:9781305627734
Author:Jeffrey D. Camm, James J. Cochran, Michael J. Fry, Jeffrey W. Ohlmann, David R. Anderson
Publisher:Cengage Learning