a)
The question requires us to draw the production possibilities curve for Romano farms.
a)
Explanation of Solution
The following graph represents the production possibilities curve for Romano farms:
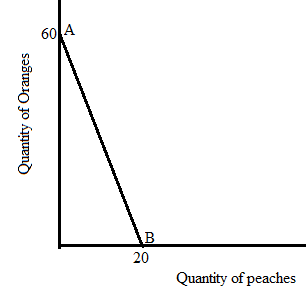
The line AB in the above graph is representing the production possibilities curve for Romano farms where X-axis shows the quantity of peaches, and y-axis shows the quantity of oranges.
The
b)
The question requires us to determine the
b)
Explanation of Solution
Opportunity cost is the next best alternative option that a person chooses. It is result of choosing one best option while forgoing next best alternative option.
Field farm’s opportunity cost of producing one bushels of peaches is 2 (=80/40) bushels of oranges.
c)
The question requires us to determine the specialization of firms, and decide whether the term of trade of four oranges in exchange for one peach is acceptable or not.
c)
Explanation of Solution
(i) To have specialization in a product the country should have a
Fields farm’s opportunity cost of producing one bushels of peaches = 80/40 = 2 bushels of oranges.
Romano farm’s opportunity cost of producing one bushels of peaches = 60/20 = 3 bushels of oranges. The opportunity cost of producing peaches is lower in field farms. So, field farm has a comparative advantage in producing peaches which indicates that field farm has specialization in the production of peaches.
(ii) Fields farm’s opportunity cost of producing one bushels of oranges = 40/80 = 0.5 bushels of peaches.
Romano farm’s opportunity cost of producing one bushels of oranges = 20/60 = 0.33 bushels of peaches.
When field farm has specialization in producing peaches, the terms of trade will be between the 2 bushels of oranges and 0.5 bushels of peaches.
So, the terms of trade of 4 oranges in exchange for one peach would be acceptable to both farms because the exchange rate is higher than the opportunity costs of oranges and peaches for both farms.
- The country with a lower opportunity cost of producing a product will have a comparative advantage in producing that product.
- The country with high production of a product in absolute terms will have an
absolute advantage in producing that product. - The rate at which one commodity can be exchanged for another is known as terms of trade.
d)
The question requires us to determine the impact of new technology on the production possibilities curve.
d)
Explanation of Solution
The following graph represents the impact of improved technology for peaches:
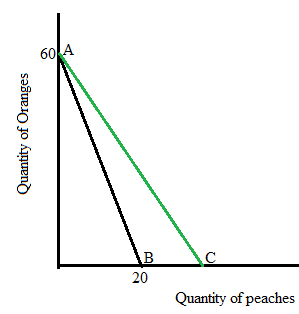
When farmers get improved technology for peaches, the production of peaches will rise and results in an outward movement of the PPC on axis representing the quantity of peaches.
The line AC shows the new production possibilities curve.
Chapter 1R Solutions
EBK KRUGMAN'S ECONOMICS F/AP COURSE

- Assume the United States is a large consumer of steel, able to influence the world price. DUS and SUS denote its demand and supply schedules in Figure 1. The overall (United States plus world) supply schedule of steel is denoted by SUS.+W. Figure 1 Import Tariff Levied by a Large Country Answer all questions (a-f) by referring to Figure 1 above. a) Calculate the free trade market equilibrium price, domestic consumption, and volumE Answer all questions (a-f) by referring to Figure 1 above. a) Calculate the free trade market equilibrium price, domestic consumption, and volume of steel imports by the US. [5 marks] b) Suppose the United States imposes a tariff (t) of $100 on each ton of steel imported. With the tariff, calculate the price of steel and the volume of steel imports by the US. [5 marks] c) Of the $100 tariff, how much is passed on to the US consumer via a higher price, and how much is borne by the foreign exporter? [5 marks] d) Calculate the tariff's deadweight welfare loss to…arrow_forward1. A doctor quits his job, which pays $77,000 per annum, to open a non-governmental organization (NGO) to serve the needs of orphans. His annual expenses for the NGO amounts to $62,700 for food and daily supplies, $9,400 for maintenance, and $1,800 for books. What is his opportunity cost of opening the NGO? (Show working) 2. During the COVID-19 pandemic, hospitals worldwide faced severe resource constraints, including: a. Limited ICU beds b. Shortage of ventilators c. Insufficient doctors and nurses d. Lack of vaccines in early 2021 Governments and hospitals had to make critical decisions about who receives treatment first and how to allocate limited resources efficiently. In no more than 150 words and using core economic concepts of scarcity, choice and opportunity cost, how would you help your government make these critical decisions?arrow_forwardWhat is the argument about necessary evil?arrow_forward
- What are the consequences of declining houses prices?arrow_forwardQ1 Explain what economic catch 22 is. Q2 What are the consequences of declining houses pricing? Q3 What is the argument about necessary evil? Q4 Explain the idea of irrational exhuberance? Q5 Explain what was the economic paradox?arrow_forward< Files 9:10 Fri Mar 21 Chapter+11-Public+Goods+and+Common+Res... The Economic Catch-22 By Robert J. Samuelson We are now in the "blame phase" of the economic cycle. As the housing slump deepens and financial markets swing erratically, we've embarked on the usual search for culprits. Who got us into this mess? Our investigations will doubtlessly reveal, as they already have, much wishful thinking and miscalculation. They will also find incompetence, predatory behavior and probably some criminality. But let me suggest that, though inevitable and necessary, this exercise is also simplistic and deceptive. -- business It assumes that, absent mistakes and misdeeds, we might remain in a permanent paradise of powerful income and wealth growth. The reality, I think, is that the economy follows its own Catch-22: By taking prosperity for granted, people perversely subvert prosperity. The more we managers, investors, consumers - think that economic growth is guaranteed and that risk and…arrow_forward
- 2.) Using the line drawing tool, plot and label the isocost line. Carefully follow the instructions above, and only draw the required objects. FILL IN BLANK d. Now suppose the price of labour rises to $5 per unit, but the firm still wants to produce 500 tires per day. Explain how a cost-minimizing firm adjusts to this change (with no change in technology). A cost-minimizing firm will be producing on ▼ The samedifferently slopedparallel isocost line. The firm will use ▼ moresameless labour and ▼ less the same amount of more capital and produce on ▼ a higher point on the same a lower point on the same a lower a higher isoquant curve.arrow_forwardQK Using the graph on the right, determine how the firm should change the quantity of the production factors in order to reduce the costs. The firm that is producing at point A can reduce its costs for producing 2000 units by employing A. same capital and more labour. B. less capital and more labour. ○ C. less capital and the same labour. D. more capital and more labour. OE. more capital and less labour. C A B Q =4000 Q = 2000 C Isocost line QLarrow_forwardPL Suppose the price ratio is the same along isocost PK lines A and B. In the figure at right, the difference between isocost line A and isocost line B is that A. the total cost is larger along B. B. the total cost is larger along A. OC. labour is relatively more expensive along A. ○ D. the level of output is lower along A. OE. both capital and labour are relatively cheaper along A. Capital B Labourarrow_forward
- Using the graph on the right, determine the per unit prices of capital and labour. 20- Given the information provided about the isocost lines, we know that the per unit price of capital is TC=$100 and the per unit price of labour is 16- TC $80 ○ A. $50; $20 ○ B. $2; $5 ○ C. $5; $2 ○ D. $20; $50 E. not determinable; not determinable Quantity of K 12 TC $60 TC $40 0 10 20 30 Quantity of L 40arrow_forwardThe diagram to the right contains isocost lines A and B. If the price of capital is the same for both lines, then the difference between isocost line A and isocost line B is that OA. the total cost is larger along B. B. the level of output is lower along A. C. both capital and labour are cheaper along A. OD. labour is more expensive along A. ○ E. labour is more expensive along B. Capital Labourarrow_forwardFor the firm whose cost curves are shown at right, the minimum efficient scale is ○ A. between 60 and 140 units of production. OB. about 20 units of production. OC. about 60 units of production. OD. about 100 units of production. OE. the level of fixed cost corresponding to SRATC2. SRATC₁ LRAC SRATC4 SRATC₂ SRATC3 เนด เad iso C 20 20 40 60 80 100 120 140 160 180 200 Output per Periodarrow_forward

 Principles of Economics (12th Edition)EconomicsISBN:9780134078779Author:Karl E. Case, Ray C. Fair, Sharon E. OsterPublisher:PEARSON
 Engineering Economy (17th Edition)EconomicsISBN:9780134870069Author:William G. Sullivan, Elin M. Wicks, C. Patrick KoellingPublisher:PEARSON
 Principles of Economics (MindTap Course List)EconomicsISBN:9781305585126Author:N. Gregory MankiwPublisher:Cengage Learning
 Managerial Economics: A Problem Solving ApproachEconomicsISBN:9781337106665Author:Luke M. Froeb, Brian T. McCann, Michael R. Ward, Mike ShorPublisher:Cengage Learning
 Managerial Economics & Business Strategy (Mcgraw-...EconomicsISBN:9781259290619Author:Michael Baye, Jeff PrincePublisher:McGraw-Hill Education