
Concept explainers
Videos
a)
To graph:
The
b)
To find:
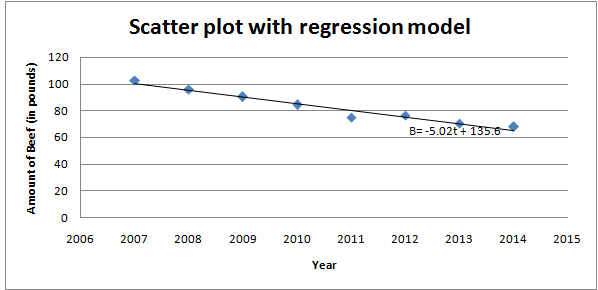
The equation of the least squares regression line that fits the data of the amount of beef produced on private farms for the years from 2007 through 2014 and to graph the model and the scatter plot in the same graph and to interpret how closely the model represents the data.
Solution:
The least squares regression equation is
The model represents a very close relationship with the data.
Explanation:
Definition:
Regression is a statistical method used to model the relationship between two sets of variables. The least squares equation is defined as,
Here, X is the independent variable, Y is the dependent variable, a is the y-intercept and b is the slope of the line.
Calculation:
Consider the provided information of the amount B (in millions of pounds) of beef produced on private farms for years from 2007 through 2017.
Assume that t represents the year with
Excel can be used to determine the least squares regression equation. The steps followed to construct the scatter plot are:
Step 1: Open Excel worksheet. Enter the provided data of years and amount of beef.
Step 2: In the menu bar, select Data➔Data Analysis.
Step 3: In the dialog that appears, select Regression. Click ‘Ok’.
Step 4: In the window that appears, select the Input Y-Range and Input X-Range and click Ok.
The least squares regression equation is obtained as,
Now, graph the model with the scatter plot in the same graph. The steps followed in Excel are:
Step 1: Open the obtained scatter plot in part (a).
Step 2: Right click on the graph and select Add Trendline from the dropdown list.
Step 3: Again Right click on the trend line added and select Format Trendline.
Step 4: In the window that appears select “Display Equation on Chart”. Click Ok.
The graph is obtained as:
The obtained graph shows the scatter plot and the regression model on the same graph. The graph shows that the data points are very close to the regression line. This indicates that there is a close relationship between the data and the model.
Want to see the full answer?
Check out a sample textbook solution
Chapter 1 Solutions
PRECALCULUS-WEBASSIGN EPIN K12 ACCESS


- Calculus lll May I please have the solution for the following exercise? Thank you so mucharrow_forwardCalculus lll May I please have the solution for the following exercise? Thank you so much,arrow_forwardCalculus lll May I please have the solution for the following exercise? Thank you so mucharrow_forward
- Calculus lll May I please have the solution for the following example? Thank youarrow_forwardCalculus lll May I please have the statement completed for the following box? Thank you so much,arrow_forwardCalculus lll May I please have the solution for the following exercise? Thank you so mucharrow_forward
- Use a graphing calculator to find where the curves intersect and to find the area between the curves. y=ex, y=-x²-4x a. The left point of intersection is (Type integers or decimals rounded to the nearest thousandth as needed. Type an ordered pair.)arrow_forwardFind the area between the curves. x= -5, x=3, y=2x² +9, y=0 The area between the curves is (Round to the nearest whole number as needed.)arrow_forwardcan you solve these questions with step by step with clear explaination pleasearrow_forward
- Find the area between the following curves. x=-1, x=3, y=x-1, and y=0 The area between the curves is (Simplify your answer.)arrow_forwardFind the area between the curves. x= − 2, x= 3, y=5x, y=x? - 6 6 The area between the curves is (Simplify your answer.) ...arrow_forwardplease question 9arrow_forward
 Glencoe Algebra 1, Student Edition, 9780079039897...AlgebraISBN:9780079039897Author:CarterPublisher:McGraw Hill
 Mathematics For Machine TechnologyAdvanced MathISBN:9781337798310Author:Peterson, John.Publisher:Cengage Learning,
 Holt Mcdougal Larson Pre-algebra: Student Edition...AlgebraISBN:9780547587776Author:HOLT MCDOUGALPublisher:HOLT MCDOUGAL
 Big Ideas Math A Bridge To Success Algebra 1: Stu...AlgebraISBN:9781680331141Author:HOUGHTON MIFFLIN HARCOURTPublisher:Houghton Mifflin Harcourt
 Elementary Geometry for College StudentsGeometryISBN:9781285195698Author:Daniel C. Alexander, Geralyn M. KoeberleinPublisher:Cengage Learning