Concept explainers
Videos
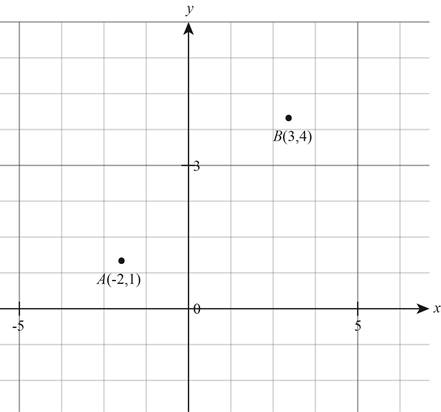
Plot the points
To plot:
The points on the same set of axes and to find the distance between A and B.
Answer to Problem 1BMO
Solution:
The points are,
The distance between the points is ![]() .
.
Explanation of Solution
Given:
The given points are,
![]() and
and ![]() .
.
Formula used:
The formula to calculate the distance between two points ![]() and
and ![]() in the plane is,
in the plane is,
![]()
Here, ![]() is the distance between the two points.
is the distance between the two points.
Calculation:
The following figure shows the graph of the given points.
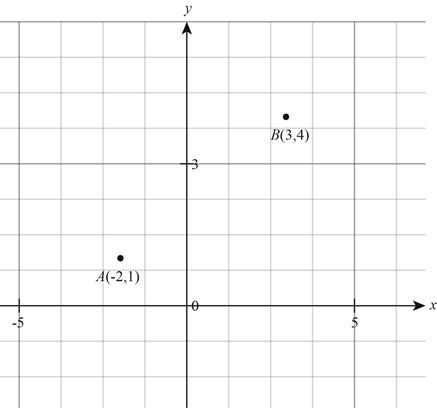
Figure (1)
Consider the formula to calculate the distance between two points ![]() and
and ![]() in the plane is,
in the plane is,
![]() …
…![]()
Substitute ![]() for
for ![]() ,
, ![]() for
for ![]() ,
, ![]() for
for ![]() and
and ![]() for
for ![]() in equation
in equation![]() .
.
Thus, the points are shown in Figure (1), and the distance between the points is ![]() .
.
Conclusion:
The points are shown in Figure (1), and the distance between the points is ![]() .
.
Want to see more full solutions like this?
Chapter 1 Solutions
Finite Mathematics For The Managerial, Life, And Social Sciences
Additional Math Textbook Solutions
Pathways To Math Literacy (looseleaf)
University Calculus
Intro Stats, Books a la Carte Edition (5th Edition)
College Algebra (Collegiate Math)
College Algebra Essentials (5th Edition)
Elementary Statistics: Picturing the World (7th Edition)


- pls helparrow_forwardx The function f is shown below. If I is the function defined by g(x) = √ ƒ(t) dt, find the value of g"(-8) in simplest form. g -1 8 y 7 10 6 LC 5 4 3 2 1 -10 -9 -8 -7 -6 -5 -4 -3 -2 -1 1 2 3 -1 -2 -3 -4 -5 56 -6 -7 -8 4 5 Graph of f 10 6 00 7 8 9 10 xarrow_forwardIn Problems 1-16 the indicated function y₁(x) is a solution of the given differential equation. Use reduction of order or formula (5), as instructed, to find a second solution y2(x). 1. y" - 4y' + 4y = 0; yı = e2xarrow_forward
- The function f is shown below. If g is an antiderivative of f such that g(6) = 2, what is the maximum value of g on the closed interval [-9,9]? 8 7 6 Сл 5 4 3 1 y Graph of f -10 -9 -8 -7 -6 -5 -4 -3 -2 -1 1 23 4 -1 -2 -3 -4 -6 56 -5 -7 -8 LO 5 9 7 8 9 10arrow_forwardx The function of is shown below. If I is the function defined by g(x) = [* f(t)dt, write the equation of the line tangent to the graph of 9 at x = -3. g y Graph of f 8 7 6 5 4 32 1 x -10 -9 -8 -7 -6 -5 -4 -3 -2 -1 1 2 3 4 5 6 7 8 9 10 -1 -2 -3 56 -6 -7 -8arrow_forward- Problem 3: For a short time, the 300-kg roller-coaster car with passengers is traveling along the spiral track at a constant speed of v = 8 m/s with r = 15 m. If the track descends d = 6 m for every full revolution, 0 = 2π rad, determine the magnitudes of the components of force which the track exerts on the car in the r, 0, and z directions. Neglect the size of the car. Bonus: Develop a MATLAB program to solve for this problem.arrow_forward
- Let f(x)=4excosxf'(x)=arrow_forwardThe graph of the function f in the figure below consists of line segments and a quarter of a circle. Let g be the function given by x g(x) = __ f (t)dt. Determine all values of a, if any, where g has a point of inflection on the open interval (-9, 9). 8 y 7 76 LO 5 4 3 2 1 -10 -9 -8 -7 -6 -5 -4 -3 -2 -1 1 2 3 ♡. -1 -2 3 -4 56 -5 -6 -7 -8 Graph of f 4 5 16 7 8 9 10arrow_forwardpls helparrow_forward
 Trigonometry (MindTap Course List)TrigonometryISBN:9781337278461Author:Ron LarsonPublisher:Cengage Learning
 Holt Mcdougal Larson Pre-algebra: Student Edition...AlgebraISBN:9780547587776Author:HOLT MCDOUGALPublisher:HOLT MCDOUGAL
 Algebra & Trigonometry with Analytic GeometryAlgebraISBN:9781133382119Author:SwokowskiPublisher:Cengage
 Elementary AlgebraAlgebraISBN:9780998625713Author:Lynn Marecek, MaryAnne Anthony-SmithPublisher:OpenStax - Rice University