
MyLab Economics with Pearson eText -- Access Card -- for Economics
7th Edition
ISBN: 9780134739403
Author: R. Glenn Hubbard, Anthony Patrick O'Brien
Publisher: PEARSON
expand_more
expand_more
format_list_bulleted
Videos
Textbook Question
Chapter 1.A, Problem 6PA
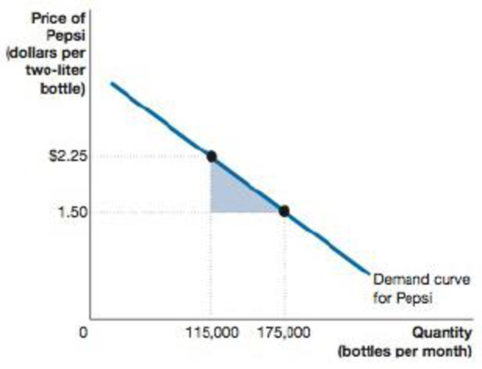
What is the area of the triangle shown in the following figure?
Expert Solution & Answer
Want to see the full answer?
Check out a sample textbook solution
Students have asked these similar questions
At the 8:10 café, there are equal numbers of two types of customers with the following values. The café owner cannot distinguish between the two types of students because many students without early classes arrive early anyway (that is she cannot price discriminate).
Students with early classes
Students without early classes
Coffee
70
60
Banana
50
100
The MC of coffee is 10. The MC of a banana is 40. Is bundling more profitable than selling separately? HINT: if you sell the bundle, can you make more by offering coffee separately?
If so, what price should be charged for the bundle? (Show calculations)
Your marketing department has identified the following customer demographics in the following table. Construct a demand curve and determine the profit maximizing price as well as the expected profit if MC=$1. The number of customers in the target population is 10,000.
Use the following demand data:
Group
Value
Frequency
Baby boomers
$5
20%
Generation X
$4
10%
Generation Y
$3
10%
`Tweeners
$2
10%
Seniors
$2
10%
Others
$0
40%
Your marketing department has identified the following customer demographics in the following table. Construct a demand curve and determine the profit maximizing price as well as the expected profit if MC=$1. The number of customers in the target population is 10,000.
Group
Value
Frequency
Baby boomers
$5
20%
Generation X
$4
10%
Generation Y
$3
10%
`Tweeners
$2
10%
Seniors
$2
10%
Others
$0
40%
ur marketing department has identified the following customer demographics in the following table. Construct a demand curve and determine the profit maximizing price as well as the expected profit if MC=$1. The number of customers in the target population is 10,000.
Chapter 1 Solutions
MyLab Economics with Pearson eText -- Access Card -- for Economics
Ch. 1.A - Prob. 1PACh. 1.A - Prob. 2PACh. 1.A - Prob. 3PACh. 1.A - Prob. 4PACh. 1.A - Prob. 5PACh. 1.A - What is the area of the triangle shown in the...Ch. 1.A - Prob. 7PACh. 1 - Prob. 1TCCh. 1 - Prob. 2TCCh. 1 - Prob. 1.1.1RQ
Ch. 1 - Prob. 1.1.2RQCh. 1 - Prob. 1.1.3PACh. 1 - Prob. 1.1.4PACh. 1 - Prob. 1.1.5PACh. 1 - Prob. 1.1.6PACh. 1 - Prob. 1.1.7PACh. 1 - Prob. 1.1.8PACh. 1 - Prob. 1.1.9PACh. 1 - Prob. 1.1.10PACh. 1 - Prob. 1.1.11PACh. 1 - Prob. 1.2.1RQCh. 1 - Prob. 1.2.2RQCh. 1 - Prob. 1.2.3RQCh. 1 - Prob. 1.2.4RQCh. 1 - Prob. 1.2.5PACh. 1 - Prob. 1.2.6PACh. 1 - Prob. 1.2.7PACh. 1 - Prob. 1.2.8PACh. 1 - Prob. 1.2.9PACh. 1 - Prob. 1.2.10PACh. 1 - Prob. 1.2.11PACh. 1 - Prob. 1.2.12PACh. 1 - Prob. 1.2.13PACh. 1 - Prob. 1.3.1RQCh. 1 - Prob. 1.3.2RQCh. 1 - Prob. 1.3.3RQCh. 1 - Prob. 1.3.4PACh. 1 - Prob. 1.3.5PACh. 1 - Prob. 1.3.6PACh. 1 - Prob. 1.3.7PACh. 1 - Prob. 1.3.8PACh. 1 - Prob. 1.3.9PACh. 1 - Prob. 1.3.10PACh. 1 - Prob. 1.3.11PACh. 1 - Prob. 1.4.1RQCh. 1 - Prob. 1.4.2RQCh. 1 - Prob. 1.4.3PACh. 1 - Prob. 1.4.4PACh. 1 - Prob. 1.1CTECh. 1 - Prob. 1.2CTE
Knowledge Booster


Learn more about
Need a deep-dive on the concept behind this application? Look no further. Learn more about this topic, economics and related others by exploring similar questions and additional content below.Similar questions
- Test Preparation QUESTION 2 [20] 2.1 Body Mass Index (BMI) is a summary measure of relative health. It is calculated by dividing an individual's weight (in kilograms) by the square of their height (in meters). A small sample was drawn from the population of UWC students to determine the effect of exercise on BMI score. Given the following table, find the constant and slope parameters of the sample regression function of BMI = f(Weekly exercise hours). Interpret the two estimated parameter values. X (Weekly exercise hours) Y (Body-Mass index) QUESTION 3 2 4 6 8 10 12 41 38 33 27 23 19 Derek investigates the relationship between the days (per year) absent from work (ABSENT) and the number of years taken for the worker to be promoted (PROMOTION). He interviewed a sample of 22 employees in Cape Town to obtain information on ABSENT (X) and PROMOTION (Y), and derived the following: ΣΧ ΣΥ 341 ΣΧΥ 176 ΣΧ 1187 1012 3.1 By using the OLS method, prove that the constant and slope parameters of the…arrow_forwardQUESTION 2 2.1 [30] Mariana, a researcher at the World Health Organisation (WHO), collects information on weekly study hours (HOURS) and blood pressure level when writing a test (BLOOD) from a sample of university students across the country, before running the regression BLOOD = f(STUDY). She collects data from 5 students as listed below: X (STUDY) 2 Y (BLOOD) 4 6 8 10 141 138 133 127 123 2.1.1 By using the OLS method and the information above derive the values for parameters B1 and B2. 2.1.2 Derive the RSS (sum of squares for the residuals). 2.1.3 Hence, calculate ô 2.2 2.3 (6) (3) Further, she replicates her study and collects data from 122 students from a rival university. She derives the residuals followed by computing skewness (S) equals -1.25 and kurtosis (K) equals 8.25 for the rival university data. Conduct the Jacque-Bera test of normality at a = 0.05. (5) Upon tasked with deriving estimates of ẞ1, B2, 82 and the standard errors (SE) of ẞ1 and B₂ for the replicated data.…arrow_forwardIf you were put in charge of ensuring that the mining industry in canada becomes more sustainable over the course of the next decade (2025-2035), how would you approach this? Come up with (at least) one resolution for each of the 4 major types of conflict: social, environmental, economic, and politicalarrow_forward
- How is the mining industry related to other Canadian labour industries? Choose one other industry, (I chose Forestry)and describe how it is related to the mining industry. How do the two industries work together? Do they ever conflict, or do they work well together?arrow_forwardWhat is the primary, secondary, tertiary, and quaternary levels of mining in Canada For each level, describe what types of careers are the most common, and describe what stage your industry’s main resource is in during that stagearrow_forwardHow does the mining industry in canada contribute to the Canadian economy? Describe why your industry is so important to the Canadian economy What would happen if your industry disappeared, or suffered significant layoffs?arrow_forward
- What is already being done to make mining in canada more sustainable? What efforts are being made in order to make mining more sustainable?arrow_forwardWhat are the environmental challenges the canadian mining industry face? Discuss current challenges that mining faces with regard to the environmentarrow_forwardWhat sustainability efforts have been put forth in the mining industry in canada Are your industry’s resources renewable or non-renewable? How do you know? Describe your industry’s reclamation processarrow_forward
- How does oligopolies practice non-price competition in South Africa?arrow_forwardWhat are the advantages and disadvantages of oligopolies on the consumers, businesses and the economy as a whole?arrow_forward1. After the reopening of borders with mainland China following the COVID-19 lockdown, residents living near the border now have the option to shop for food on either side. In Hong Kong, the cost of food is at its listed price, while across the border in mainland China, the price is only half that of Hong Kong's. A recent report indicates a decline in food sales in Hong Kong post-reopening. ** Diagrams need not be to scale; Focus on accurately representing the relevant concepts and relationships rather than the exact proportions. (a) Using a diagram, explain why Hong Kong's food sales might have dropped after the border reopening. Assume that consumers are indifferent between purchasing food in Hong Kong or mainland China, and therefore, their indifference curves have a slope of one like below. Additionally, consider that there are no transport costs and the daily food budget for consumers is identical whether they shop in Hong Kong or mainland China. I 3. 14 (b) In response to the…arrow_forward
arrow_back_ios
SEE MORE QUESTIONS
arrow_forward_ios
Recommended textbooks for you
 Economics (MindTap Course List)EconomicsISBN:9781337617383Author:Roger A. ArnoldPublisher:Cengage Learning

 Microeconomics: Principles & PolicyEconomicsISBN:9781337794992Author:William J. Baumol, Alan S. Blinder, John L. SolowPublisher:Cengage Learning
 Macroeconomics: Principles and Policy (MindTap Co...EconomicsISBN:9781305280601Author:William J. Baumol, Alan S. BlinderPublisher:Cengage Learning
Economics (MindTap Course List)
Economics
ISBN:9781337617383
Author:Roger A. Arnold
Publisher:Cengage Learning
Microeconomics: Principles & Policy
Economics
ISBN:9781337794992
Author:William J. Baumol, Alan S. Blinder, John L. Solow
Publisher:Cengage Learning
Macroeconomics: Principles and Policy (MindTap Co...
Economics
ISBN:9781305280601
Author:William J. Baumol, Alan S. Blinder
Publisher:Cengage Learning
Forecasting: Exponential Smoothing, MSE; Author: Joshua Emmanuel;https://www.youtube.com/watch?v=k_HN0wOKDd0;License: Standard Youtube License