
(a)
The
Answer to Problem 1E
Hence, the price along the vertical axis and the quantity along the horizontal axis has been determined and the first two columns have been plotted.
Explanation of Solution
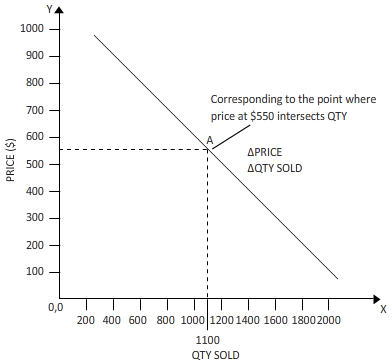
The graph is plotted by joining 3 points of price on Y-axis to the corresponding quantity sold on the X-axis.
To find the quantity sold when the price is a certain dollar, we can take the help of the line obtained by plotting 3 price point in the Y-axis to the corresponding quantity in the x-axis in the graph sheet, and join them to form a sloping straight line.
Once the new quantity is found for a particular price point from the above straight line, we can use this information to find the total revenue at that price.
(b)
The quantity sold when the price is $550.
Answer to Problem 1E
When the price is 550$, the quantity sold is 1100.
Explanation of Solution
From the above-plotted line on the graph, we find that the point when the price on Y-axis is 550$, the corresponding quantity sold on X-axis is 1100 numbers.
To find the quantity sold when the price is a certain dollar, we can take the help of the line obtained by plotting 3 price point in the Y-axis to the corresponding quantity in the x-axis in the graph sheet, and join them to form a sloping straight line.
Once the new quantity is found for a particular price point from the above straight line, we can use this information to find the total revenue at that price.
(c)
To plot a graph and to measure the quantity on the horizontal axis and to determine the total revenue on the vertical axis.
Answer to Problem 1E
The graph is plotted and the quantity sold at 550$ is 1100 numbers.
Explanation of Solution
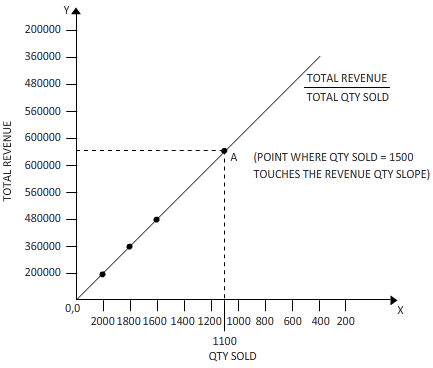
Now in the graph drawn above, the quantity sold is taken on X-axis while the total revenue obtained for that numbers of corresponding quantity sold is taken on Y-AXIS.
Next, we plot the points of total quantity sold on the horizontal X-axis versus the total Revenue obtained by selling each number of that quantity on the vertical Y-Axis. We take such thee points where the quantity-sold and corresponding revenue interacts, and join them to form a straight line.
To find the quantity sold when the price is at a certain dollar, we can take the help of the line obtained by plotting 3 price point in the Y-axis to the corresponding quantity in the x-axis in the graph sheet, and join them to form a sloping straight line.
Once the new quantity is found for a particular price point from the above straight line, we can use this information to find the total revenue at that price.
(d)
The total revenue when the price is $550 and to determine if the total revenue will increase or decrease when the price is lowered.
Answer to Problem 1E
When the quantity sold is $ 550, the total revenue is $ 6,40,000.
Explanation of Solution
We already know the quantity sold at each price point. Conversely, we know the price too when a particular number of items is sold. In this problem, the total revenue is to be found when the price is 550$. Now the corresponding total revenue to 1100 numbers is found to be 6,40,000 on the Y-axis. As we can see from the graph, decrease in price will increase the revenue.
To find the quantity sold when the price is a certain dollar, we can take the help of the line obtained by plotting 3 price point in the Y-axis to the corresponding quantity in the x-axis in the graph sheet, and join them to form a sloping straight line.
Once the new quantity is found for a particular price point from the above straight line, we can use this information to find the total revenue at that price.
Want to see more full solutions like this?
Chapter 1A Solutions
Macroeconomics (MindTap Course List)

- Published in 1980, the book Free to Choose discusses how economists Milton Friedman and Rose Friedman proposed a one-sided view of the benefits of a voucher system. However, there are other economists who disagree about the potential effects of a voucher system.arrow_forwardThe following diagram illustrates the demand and marginal revenue curves facing a monopoly in an industry with no economies or diseconomies of scale. In the short and long run, MC = ATC. a. Calculate the values of profit, consumer surplus, and deadweight loss, and illustrate these on the graph. b. Repeat the calculations in part a, but now assume the monopoly is able to practice perfect price discrimination.arrow_forwardThe projects under the 'Build, Build, Build' program: how these projects improve connectivity and ease of doing business in the Philippines?arrow_forward
- Critically analyse the five (5) characteristics of Ubuntu and provide examples of how they apply to the National Health Insurance (NHI) in South Africa.arrow_forwardCritically analyse the five (5) characteristics of Ubuntu and provide examples of how they apply to the National Health Insurance (NHI) in South Africa.arrow_forwardOutline the nine (9) consumer rights as specified in the Consumer Rights Act in South Africa.arrow_forward

 Economics Today and Tomorrow, Student EditionEconomicsISBN:9780078747663Author:McGraw-HillPublisher:Glencoe/McGraw-Hill School Pub Co
 Managerial Economics: Applications, Strategies an...EconomicsISBN:9781305506381Author:James R. McGuigan, R. Charles Moyer, Frederick H.deB. HarrisPublisher:Cengage Learning
 Essentials of Economics (MindTap Course List)EconomicsISBN:9781337091992Author:N. Gregory MankiwPublisher:Cengage Learning
 Exploring EconomicsEconomicsISBN:9781544336329Author:Robert L. SextonPublisher:SAGE Publications, Inc
 Microeconomics: Private and Public Choice (MindTa...EconomicsISBN:9781305506893Author:James D. Gwartney, Richard L. Stroup, Russell S. Sobel, David A. MacphersonPublisher:Cengage Learning