
a)
To Analyze: The effect, on the exchange rate between yen and dollar when Japan opens domestic market to more foreign competition, by using supply-and-
a)
Answer to Problem 1TY
The exchange rate for American dollars increases when Japan opens domestic market to more number of foreign countries.
Explanation of Solution
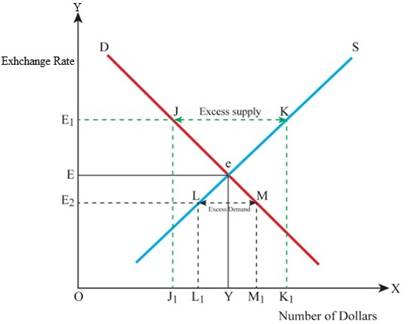
The below mentioned diagram shows the exchange rate being determined based on the supply of dollars in the foreign exchange market.

In the above mentioned graph the
At the point e, the demand for dollar becomes equal to the supply of dollars, and this point is considered as the equilibrium point. For the dollar at Y, the exchange rate will be E. The supply of dollar is K, for the demand for dollar j, and the excess of dollar supply will cause decrease in the value of dollar, subsequent decrease in the exchange rate from
When Japan opens its domestic market to foreign countries, the import also increases, causing an increase in the demand for American dollars in the foreign exchange market. The value of dollar will be appreciated with increase in its demand, thus increasing the exchange rate.
b)
To Analyze: The effect, on the exchange rate between yen and dollar when the value in Tokyo stock market is believed to be falling, by the investors using the supply-and-demand diagrams.
b)
Answer to Problem 1TY
As there is an outflow of funds in order to invest in American Stock Exchange, there will be an increase in the exchange rate also.
Explanation of Solution
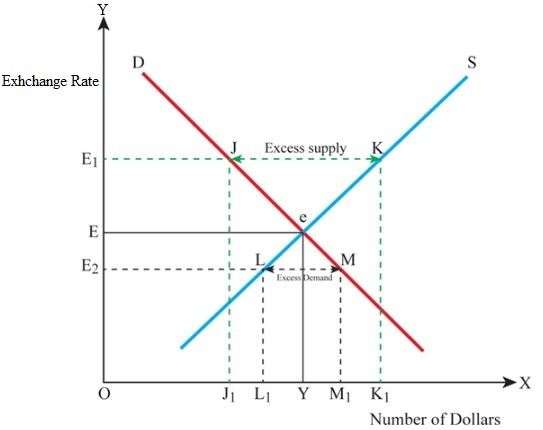
The below mentioned diagram shows the exchange rate being determined based on the supply of dollars in the foreign exchange market.

In the above mentioned graph the
At the point e, the demand for dollar becomes equal to the supply of dollars, and this point is considered as the equilibrium point. For the dollar at Y, the exchange rate will be E. The supply of dollar is K, for the demand for dollar j, and the excess of dollar supply will cause a decrease in the value of dollar, subsequently resulting in a decrease in the exchange rate from
When the investors feel that the value in Tokyo Stock Market is falling, they will start diverting their investments in to American Stock Market. Thus, there will be a capital outflow from Japan to America, which in turn will increase the demand for American dollars in the foreign exchange and the value of dollar also increases. Subsequently there will be an increase in the exchange rate.
c)
To Analyze: The effect, on the exchange rate between yen and dollar when the interest rates are cut by FR in United States, by using supply-and-demand diagrams.
c)
Answer to Problem 1TY
When there is a cut in interest rates by FR, the value of yen increases in foreign exchange and the exchange rate of dollar decreases.
Explanation of Solution
The below mentioned diagram shows the exchange rate being determined based on the supply of dollars in the foreign exchange market.

In the above mentioned graph the
At the point e, the demand for dollar becomes equal to the supply of dollars, and this point is considered as the equilibrium point. For the dollar at Y, the exchange rate will be E. The supply of dollar is K, for the demand for dollar j, and the excess of dollar supply will cause decrease in the value of dollar, subsequently causing a decrease in the exchange rate from
As there is a cut in interest rates in FR, investors will be attracted to higher interest rates being offered by Japan and starts diverting their investments to Japan. Thus the demand for Japanese Yen becomes more in the foreign exchange market, increasing the value of yen against that of dollar, thus decreasing the exchange rate of dollar.
d)
To Analyze: The effect, on the exchange rate between yen and dollar, when huge amounts of foreign aid is given to Israel and her Arab neighbors, by the United States, in order to settle problems in Middle East, by using supply-and-demand diagrams.
d)
Answer to Problem 1TY
When United States gives huge sum of money for settling problems in Middle East, the value of dollar decreases and hence its exchange rate also decreases.
Explanation of Solution
The below mentioned diagram shows the exchange rate being determined based on the supply of dollars in the foreign exchange market.
In the above mentioned graph the
At the point e, the demand for dollar becomes equal to the supply of dollars, and this point is considered as the equilibrium point. For the dollar at Y, the exchange rate will be E. The supply of dollar is K, for the demand for dollar j, and the excess of dollar supply will cause a decrease in the value of dollar, subsequently resulting in a decrease in the exchange rate from
When huge amounts of aid is given to Israel and her neighbors to settle problems in Middle East, there will be an increase in supply of dollars in to the foreign exchange market, which in turn decreases the value of dollar thus decreasing its exchange rate.
e)
To Analyze: The effect, on the exchange rate between yen and dollar, when there is recession in United States and boom in Japan, by using supply-and-demand diagrams.
e)
Answer to Problem 1TY
When there is recession in United States, the value of dollar increases thereby increasing its exchange rate.
Explanation of Solution
The below mentioned diagram shows the exchange rate being determined based on the supply of dollars in the foreign exchange market.

In the above mentioned graph the
At the point e, the demand for dollar becomes equal to the supply of dollars, and this point is considered as the equilibrium point. For the dollar at Y, the exchange rate will be E. The supply of dollar is K, for the demand for dollar j, and the excess of dollar supply will cause a decrease in the value of dollar, subsequently causing a decrease in the exchange rate from
When there is recession in United States, its imports decreases and export increases, and when there is a boom in Japan, its imports increases and export decreases. Thus the demand for Yen by United States decreases, while the demand for dollar by Japan increases, increasing the value of dollar, and thereby increase in its exchange rate.
f)
To Analyze: The effect, on the exchange rate between yen and dollar, when inflation in United States exceeds than that in Japan, by using supply-and-demand diagrams.
f)
Answer to Problem 1TY
When there is inflation in the United States more than that in Japan, then the value of dollar decreases, thereby decreasing its exchange rate.
Explanation of Solution
The below mentioned diagram shows the exchange rate being determined based on the supply of dollars in the foreign exchange market.
In the above mentioned graph the
At the point e, the demand for dollar becomes equal to the supply of dollars, and this point is considered as the equilibrium point. For the dollar at Y, the exchange rate will be E. The supply of dollar is K, for the demand for dollar j, and the excess of dollar supply will cause decrease in the value of dollar, subsequently resulting in decrease in the exchange rate from
When there is inflation in United States than that of Japan, the imports in United States increases, which increases the supply of dollars in foreign exchange market. This decreases the value of dollar, thereby decreasing its exchange rate.
Want to see more full solutions like this?
Chapter 19 Solutions
Macroeconomics: Principles and Policy (MindTap Course List)

- Your marketing department has identified the following customer demographics in the following table. Construct a demand curve and determine the profit maximizing price as well as the expected profit if MC=$1. The number of customers in the target population is 10,000. Use the following demand data: Group Value Frequency Baby boomers $5 20% Generation X $4 10% Generation Y $3 10% `Tweeners $2 10% Seniors $2 10% Others $0 40%arrow_forwardYour marketing department has identified the following customer demographics in the following table. Construct a demand curve and determine the profit maximizing price as well as the expected profit if MC=$1. The number of customers in the target population is 10,000. Group Value Frequency Baby boomers $5 20% Generation X $4 10% Generation Y $3 10% `Tweeners $2 10% Seniors $2 10% Others $0 40% ur marketing department has identified the following customer demographics in the following table. Construct a demand curve and determine the profit maximizing price as well as the expected profit if MC=$1. The number of customers in the target population is 10,000.arrow_forwardTest Preparation QUESTION 2 [20] 2.1 Body Mass Index (BMI) is a summary measure of relative health. It is calculated by dividing an individual's weight (in kilograms) by the square of their height (in meters). A small sample was drawn from the population of UWC students to determine the effect of exercise on BMI score. Given the following table, find the constant and slope parameters of the sample regression function of BMI = f(Weekly exercise hours). Interpret the two estimated parameter values. X (Weekly exercise hours) Y (Body-Mass index) QUESTION 3 2 4 6 8 10 12 41 38 33 27 23 19 Derek investigates the relationship between the days (per year) absent from work (ABSENT) and the number of years taken for the worker to be promoted (PROMOTION). He interviewed a sample of 22 employees in Cape Town to obtain information on ABSENT (X) and PROMOTION (Y), and derived the following: ΣΧ ΣΥ 341 ΣΧΥ 176 ΣΧ 1187 1012 3.1 By using the OLS method, prove that the constant and slope parameters of the…arrow_forward
- QUESTION 2 2.1 [30] Mariana, a researcher at the World Health Organisation (WHO), collects information on weekly study hours (HOURS) and blood pressure level when writing a test (BLOOD) from a sample of university students across the country, before running the regression BLOOD = f(STUDY). She collects data from 5 students as listed below: X (STUDY) 2 Y (BLOOD) 4 6 8 10 141 138 133 127 123 2.1.1 By using the OLS method and the information above derive the values for parameters B1 and B2. 2.1.2 Derive the RSS (sum of squares for the residuals). 2.1.3 Hence, calculate ô 2.2 2.3 (6) (3) Further, she replicates her study and collects data from 122 students from a rival university. She derives the residuals followed by computing skewness (S) equals -1.25 and kurtosis (K) equals 8.25 for the rival university data. Conduct the Jacque-Bera test of normality at a = 0.05. (5) Upon tasked with deriving estimates of ẞ1, B2, 82 and the standard errors (SE) of ẞ1 and B₂ for the replicated data.…arrow_forwardIf you were put in charge of ensuring that the mining industry in canada becomes more sustainable over the course of the next decade (2025-2035), how would you approach this? Come up with (at least) one resolution for each of the 4 major types of conflict: social, environmental, economic, and politicalarrow_forwardHow is the mining industry related to other Canadian labour industries? Choose one other industry, (I chose Forestry)and describe how it is related to the mining industry. How do the two industries work together? Do they ever conflict, or do they work well together?arrow_forward
- What is the primary, secondary, tertiary, and quaternary levels of mining in Canada For each level, describe what types of careers are the most common, and describe what stage your industry’s main resource is in during that stagearrow_forwardHow does the mining industry in canada contribute to the Canadian economy? Describe why your industry is so important to the Canadian economy What would happen if your industry disappeared, or suffered significant layoffs?arrow_forwardWhat is already being done to make mining in canada more sustainable? What efforts are being made in order to make mining more sustainable?arrow_forward
- What are the environmental challenges the canadian mining industry face? Discuss current challenges that mining faces with regard to the environmentarrow_forwardWhat sustainability efforts have been put forth in the mining industry in canada Are your industry’s resources renewable or non-renewable? How do you know? Describe your industry’s reclamation processarrow_forwardHow does oligopolies practice non-price competition in South Africa?arrow_forward

 Macroeconomics: Private and Public Choice (MindTa...EconomicsISBN:9781305506756Author:James D. Gwartney, Richard L. Stroup, Russell S. Sobel, David A. MacphersonPublisher:Cengage Learning
 Economics: Private and Public Choice (MindTap Cou...EconomicsISBN:9781305506725Author:James D. Gwartney, Richard L. Stroup, Russell S. Sobel, David A. MacphersonPublisher:Cengage Learning
 Exploring EconomicsEconomicsISBN:9781544336329Author:Robert L. SextonPublisher:SAGE Publications, Inc
