
(a)
To explain:
The effect of an increase in government purchase in the short run on the given two diagrams.
Answer to Problem 1P
The effect of an increase in government purchase is shown on the diagrams below:
Explanation of Solution
Government purchase is a part of aggregate
Government purchase:
The goods and services bought by the government to undertake infrastructural developments and other developmental activities is referred as government purchase.
(b)
To explain:
The effect of reduced growth rate of money supply in the short run on the given two diagrams.
Answer to Problem 1P
The effect of decrease in growth rate of money supply is shown on the diagrams below:
Explanation of Solution
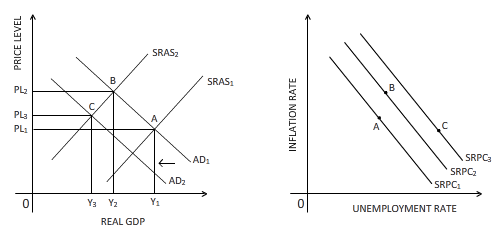
A reduction in the growth rate of money supply affects the aggregate demand negatively through the real balance effect. This leads to a leftward shift of the aggregate demand curve from AD1 to AD2. The new equilibrium point is established at point C, where both real GDP and price level are lower than that of the equilibrium point at B. Due to fall in real GDP, there will be rise in unemployment, and hence the SRPC line shifts rightward from SRPC2 to SRPC3. The new equilibrium point C is shown on the SRPC3 in the right-hand side diagram.
Money supply:
The amount of money in the form of currency and other financial liquid instruments supplied in an economy over a specific time period is referred as money supply.
(c)
To explain:
The effect of an expected higher inflation in the short run on the given two diagrams.
Answer to Problem 1P
The effect of an expected higher inflation is shown on the diagrams below:

Explanation of Solution
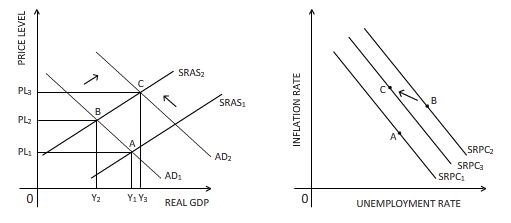
If people expect that higher inflation is approaching, they will increase their consumption expenditure to ward off the high inflation. Therefore, the aggregate demand will rise in the short run. This is reflected in the rightward shift of the aggregate demand curve from AD1 to AD2 in the above diagram. This results in a new equilibrium point C in the diagram where both real GDP and price level are higher than that of point B. On the right-hand side diagram, the SRPC line shifts from SRPC2 to SRPC3 because as real GDP grows at each level of inflation rate, unemployment falls. The new equilibrium point C is marked on SRPC3 line.
Inflation rate:
The rate at which the price level of an economy rises is termed as the rate of inflation. An increased inflation rate decreases the
(d)
To explain:
The effect of a favorable supply shock on the given two diagrams.
Answer to Problem 1P
The effect of supply shock is shown on the diagrams below:
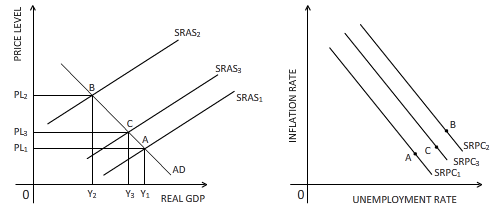
Explanation of Solution
A favorable supply shock will push the supply of the economy upward, causing the
Supply shock:
An event which leads to a sudden rise or fall in the supply of goods and services is referred as supply shock.
Want to see more full solutions like this?

- Test Preparation QUESTION 2 [20] 2.1 Body Mass Index (BMI) is a summary measure of relative health. It is calculated by dividing an individual's weight (in kilograms) by the square of their height (in meters). A small sample was drawn from the population of UWC students to determine the effect of exercise on BMI score. Given the following table, find the constant and slope parameters of the sample regression function of BMI = f(Weekly exercise hours). Interpret the two estimated parameter values. X (Weekly exercise hours) Y (Body-Mass index) QUESTION 3 2 4 6 8 10 12 41 38 33 27 23 19 Derek investigates the relationship between the days (per year) absent from work (ABSENT) and the number of years taken for the worker to be promoted (PROMOTION). He interviewed a sample of 22 employees in Cape Town to obtain information on ABSENT (X) and PROMOTION (Y), and derived the following: ΣΧ ΣΥ 341 ΣΧΥ 176 ΣΧ 1187 1012 3.1 By using the OLS method, prove that the constant and slope parameters of the…arrow_forwardQUESTION 2 2.1 [30] Mariana, a researcher at the World Health Organisation (WHO), collects information on weekly study hours (HOURS) and blood pressure level when writing a test (BLOOD) from a sample of university students across the country, before running the regression BLOOD = f(STUDY). She collects data from 5 students as listed below: X (STUDY) 2 Y (BLOOD) 4 6 8 10 141 138 133 127 123 2.1.1 By using the OLS method and the information above derive the values for parameters B1 and B2. 2.1.2 Derive the RSS (sum of squares for the residuals). 2.1.3 Hence, calculate ô 2.2 2.3 (6) (3) Further, she replicates her study and collects data from 122 students from a rival university. She derives the residuals followed by computing skewness (S) equals -1.25 and kurtosis (K) equals 8.25 for the rival university data. Conduct the Jacque-Bera test of normality at a = 0.05. (5) Upon tasked with deriving estimates of ẞ1, B2, 82 and the standard errors (SE) of ẞ1 and B₂ for the replicated data.…arrow_forwardIf you were put in charge of ensuring that the mining industry in canada becomes more sustainable over the course of the next decade (2025-2035), how would you approach this? Come up with (at least) one resolution for each of the 4 major types of conflict: social, environmental, economic, and politicalarrow_forward
- How is the mining industry related to other Canadian labour industries? Choose one other industry, (I chose Forestry)and describe how it is related to the mining industry. How do the two industries work together? Do they ever conflict, or do they work well together?arrow_forwardWhat is the primary, secondary, tertiary, and quaternary levels of mining in Canada For each level, describe what types of careers are the most common, and describe what stage your industry’s main resource is in during that stagearrow_forwardHow does the mining industry in canada contribute to the Canadian economy? Describe why your industry is so important to the Canadian economy What would happen if your industry disappeared, or suffered significant layoffs?arrow_forward
- What is already being done to make mining in canada more sustainable? What efforts are being made in order to make mining more sustainable?arrow_forwardWhat are the environmental challenges the canadian mining industry face? Discuss current challenges that mining faces with regard to the environmentarrow_forwardWhat sustainability efforts have been put forth in the mining industry in canada Are your industry’s resources renewable or non-renewable? How do you know? Describe your industry’s reclamation processarrow_forward
- How does oligopolies practice non-price competition in South Africa?arrow_forwardWhat are the advantages and disadvantages of oligopolies on the consumers, businesses and the economy as a whole?arrow_forward1. After the reopening of borders with mainland China following the COVID-19 lockdown, residents living near the border now have the option to shop for food on either side. In Hong Kong, the cost of food is at its listed price, while across the border in mainland China, the price is only half that of Hong Kong's. A recent report indicates a decline in food sales in Hong Kong post-reopening. ** Diagrams need not be to scale; Focus on accurately representing the relevant concepts and relationships rather than the exact proportions. (a) Using a diagram, explain why Hong Kong's food sales might have dropped after the border reopening. Assume that consumers are indifferent between purchasing food in Hong Kong or mainland China, and therefore, their indifference curves have a slope of one like below. Additionally, consider that there are no transport costs and the daily food budget for consumers is identical whether they shop in Hong Kong or mainland China. I 3. 14 (b) In response to the…arrow_forward

 Economics (MindTap Course List)EconomicsISBN:9781337617383Author:Roger A. ArnoldPublisher:Cengage Learning

 Exploring EconomicsEconomicsISBN:9781544336329Author:Robert L. SextonPublisher:SAGE Publications, Inc
 Principles of Economics (MindTap Course List)EconomicsISBN:9781305585126Author:N. Gregory MankiwPublisher:Cengage Learning