Concept explainers
Videos
The scores of a test for an engineering class of 30 students are shown here. Organize the data in a manner similar to Table 19.1 and use Excel to create a histogram.
Scores: 57, 94, 81, 77, 66, 97, 62, 86, 75, 87, 91, 78, 61, 82, 74, 72, 70, 88, 66, 75, 55, 66, 58, 73, 79, 51, 63, 77, 52, 84
Create a histogram for the test scores of an engineering class students using Excel.
Explanation of Solution
Given data:
Number of students,
Students test scores are 57, 94, 81, 77, 66, 97, 62, 86, 75, 87, 91, 78, 61, 82, 74, 72, 70, 88, 66, 75, 55, 66, 58, 73, 79, 51, 63, 77, 52, 84.
Calculation:
The given test scores are organized in a grouped frequency distribution manner which is shown in Table 1. In the distribution, the frequency represents the number of test scores in a given range.
Table 1
| Scores | Range | Frequency |
| 57, 55, 58, 51, 52 | 50-59 | 5 |
| 66, 62, 61, 66, 66, 63 | 60-69 | 6 |
| 77, 75, 78, 74, 72, 70, 75, 73, 79, 77 | 70-79 | 10 |
| 81, 86, 87, 82, 88, 84 | 80-89 | 6 |
| 94, 97, 91 | 90-99 | 3 |
Draw the histogram for the students test scores for the respective frequency
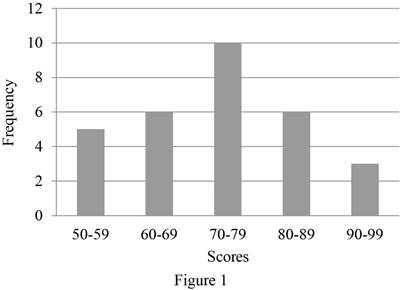
Therefore, the histogram for the test scores of engineering class students is shown in Figure 1.
Conclusion:
Thus, the histogram for the test scores of an engineering class students has been created using Excel.
Want to see more full solutions like this?
Chapter 19 Solutions
Engineering Fundamentals: An Introduction to Engineering


- Please answer the following questions and make sure you answer each question please.arrow_forwardWater is discharged into the atmosphere through a bent nozzle of an angle (a) as shown in the figure. The cross-sectional area at the nozzle inlet and outlet are (Ain) and (Aout), respectively. The discharge through the nozzle is (Q). The gauge pressure at the nozzle inlet is (Pin). The bend lies in a horizontal plane. Ain Vin Aout X Atmosphere Vout Problem (10): Given the values of Ain [m2], Aout [m²], Pin [atm], Q [m³/s], and a [degrees], calculate the magnitude of the reaction force component in y-direction (Ry) in [N]. Givens: A in 0.169 m^2 A out Pin 0.143 m^2 0.552 atm = Q α 0.367 m^3/s = 31.72 degrees Answers: ( 1 ) 6264.193 N (2) 12041.886 N ( 3 ) 8715.747 N ( 4 ) 7139.937 Narrow_forwardProblem (12): A pump is being used to lift water from the bottom tank to the top tank in a pipe of diameter (d) at a discharge (Q). The pipe system comprises four Long radius 90° threaded elbows. The pipe entrance is sharp-edged, and the pipe exit is sudden. A Ball valve (1/3 closed) is used to control the discharge in the pipeline. Given the values of Q [Lit/s], and d [cm], calculate the power loss due to components (i.e., minor losses) in the pipe (Wminor-loss) in [W]. Givens: Q = 12.275 lit/s d = 6.266 cm Answers: ( 1 ) 1142.006 W (2) 952.086 W ( 3 ) 1225.555 W ( 4 ) 1331.216 W Loss Coefficients for Pipe Components (h,= K,Y) Component a. Elbows KL elbow Regular 90°, flanged 0.3 Regular 90°, threaded 1.5 Long radius 90°, flanged 0.2 V 90° elbow Long radius 90°, threaded 0.7 Long radius 45°, flanged 0.2 0.4 Regular 45°, threaded . 180° return bends 180° return bend, flanged 0.2 V 45° elbow 180° return bend, threaded 1.5 c. Tees Line flow, flanged 0.2 Line flow, threaded 0.9 180°…arrow_forward
- Compute for the stresses (initial, const and final stage) and check for compliance in NSCP provisions. Also compute the following: 1. Compute and check if the section is Uncracked, Transition or Cracked as per NSCP. 2. Compute for its flexural capacity and check if it could carry the given load. BEAM SECTION NOT TO SCALE 1400mm 300 $1098 400 */ 400*300* 300 200 300 100 ORIGINAL SECTION/PRECA CAST-IN-PLACE (CIP) PART PRECAST LOADING AT SERVICE M • 21 KN (DEAD LOAD ONLY) 21KN 4.75m 9.25m CIVEN DATA STRANDS: 12-02 AT 120KN/STRAND (GOMM FROM BOTTOM) 8-2 AT 120HN/STRAND (120mm FROM BOTTOM) fc 42.5 MPa (BEAM) fc 38 MPa (CIP) f'a = 80% or fa fp-1860 MPa ESTRANDS 1976Pa OONG 23.6/m³ LOES 1-8% Loss 18% APPLY 3M LIVE LOAD AT CONST. PHASEarrow_forward4. Determine the stability of the cantilever shown in the figure below (use Coulomb earth theory for the lateral stress due to the backfill material). 1 m 0.5 m Backfill 7 = 18.5 kN/m³ • = 30° 20 6 = 20° 6 m Y₁ = 24 kN/m³ 1.2 m 1 m 4.5 m Base soil Clay: 7 = 19 kN/m³,0 = 30%, 0,, = 20°, s,, = 94 kPa a. With s₁ = c = 94 kPa (disregard values), determine allowable soil bearing capacity of the base soil if the factor of safety is equal to 3. b. Determine the FS against overturning. C. Determine the FS against sliding if the coefficient of friction between footing concrete base and soil is b. d. Determine the FS for bearing capacity.arrow_forwardDirections: Show your solutions explicitly, i.e., do not just write the final answer. 1. A wall footing is to be constructed on a clay soil 1.4 below the ground. The footing is to support a wall that imposes a load of 130 kN per meter of wall length. Considering general shear failure, determine the following: 130 kN/mm 1.4 m a. Footing width if the factor of safety is 3. b. Ultimate bearing capacity if B = 0.95 m. C. New factor of safety. y = 17.92 kN/m² c = 14.5 kPa $ = 30° 1.5 m and has its hottom 2 m below the ground surface.arrow_forward
- 2. A square footing shown has a dimension of 1.5 m x 1.5 m and has its bottom 2 m below the ground surface. The groundwater table is located at a depth of 3 m below the ground surface. Assume a general shear failure. Determine the following: 2 m y = 16 kN/m³ c = 14.5 kPa → = 28° 3 m 1,5 m ysat 18.5 kN/m³ a. Ultimate bearing capacity of the soil beneath the footing (in kPa). b. Allowable bearing capacity if it has a factor of safety of 3 (in kPa). C. Allowable load that the footing could carry (in kN). d. Allowable net bearing capacity if factor of safety is 3. Allowable net load if factor of safety is 3.arrow_forwardProblem (11): A pipe discharges an unknown fluid into the atmosphere from a tank of depth (h) through a pipe of length (L), and diameter (d). Given the values of L [m], d [cm], and (h) [cm], calculate the discharge rate (Q) [lit/s] that would maintain Laminar flow in the pipe with a Reynolds number of Re-1500. Ignore minor losses. Givens: L = 139.364 m d = 12.614 cm h = 76.609 cm Answers: ( 1 ) 6.911 lit/s (2) 8.179 lit/s ( 3 ) 4.244 lit/s (4) 4.987 lit/s h darrow_forwardB2. For the truss below, determine all member forces. Hint: see the provided slide with the problem set. P₁ = 12 kip and P2 = 6 kip (20 pts). P₁ A 16 ft D 8 ft 8 ft 8 ft B J K E 8 ft 8 ft I H G 8 ft 8 ft 8 ft B₁₂ F ΠΟΙΟΣarrow_forward
- Directions: Show your solutions explicitly, I.e., do not just write the final answer. Always simplify and box your final answer. 1. A wall footing is to be constructed on a clay soll 1.4 below the ground. The footing is to support a wall that imposes a load of 130 kN per meter of wall length. Considering general shear failure, determine the following: 130 kN/m 4m a. Footing width if the factor of safety is 3. b. Ultimate bearing capacity if B = 0.95 m. c. New factor of safety. Y = 17.92 kN/m² c = 14.5 kPa $ -30° 2. A square footing shown has a dimension of 1.5 mx 1.5 m and has its bottom 2 m below the ground surface. The groundwater table is located at a depth of 3 m below the ground surface. Assume a general shear failure. Determine the following: L 2 m y = 16 kN/m³ c = 14.5 kPa = 28° 3 m 1.5 m Ysa1 = 18.5 kN/m³ a. Ultimate bearing capacity of the soll beneath the footing (in kPa). b. Allowable bearing capacity if it has a factor of safety of 3 (in kPa). C. Allowable load that the…arrow_forwardB2. For the truss below, determine all member forces. Hint: see the provided slide with the problem set. P₁ = 12 kip and P₂ = 6 kip (20 pts). P₁ 16 ft D 8 ft 8 ft 8 ft B K E 8 ft 8 ft 8 ft H 8 ft В G 1000 8 ftarrow_forward14.1 A beam of rectangular cross section is 125 mm wide and 200 mm deep. If the maximum bending moment is 28.5 kN⚫m, determine (a) the maximum tensile and compressive bending stress, and (b) the bending stress 25 mm from the top of the section. 14.2 A rectangular beam 50 mm wide and 100 mm deep is subjected to bending. What bending moment will cause a maximum bending stress of 137.9 MN/m² (MPa)? 14.3 Determine the bending moment in a rectangular beam 3 in. wide and 6 in. deep if the maximum bend- ing stress is 15,000 psi.arrow_forward
 Engineering Fundamentals: An Introduction to Engi...Civil EngineeringISBN:9781305084766Author:Saeed MoaveniPublisher:Cengage Learning