To state:
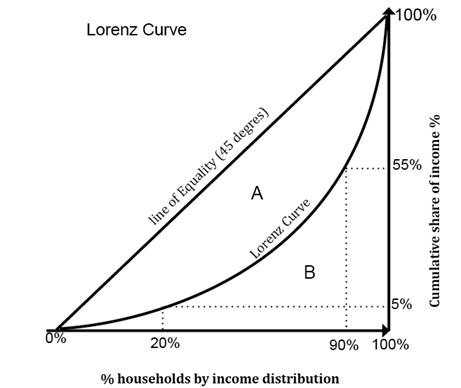
the concept of Lorenz curve and the shape of Lorenz curve when the income is equally distributed and would the curve bow upwards above the income equality line.
Explanation of Solution
Lorenz curve:
is defined as a curve that measures the degree of inequality of income distribution of an economy.
When the income is equally distributed, the Lorenz curve will be a straight 45 degree line.
In case of a normal economy, the Lorenz curve will lie beneath it, presenting the reality of wealth distribution.
As per the definition, this curve cannot be bowed upward as the bottom 10% of incomes can't earn more than the top 90% of incomes.
Lorenz curve:
is defined as a curve that measures the degree of inequality of income distribution of an economy.
In other words, it is defined as a graph on which the cumulative percentage of total
The degrees to which this curve sags below the straight line represents the degree of inequality in the distribution of income.
Want to see more full solutions like this?
Chapter 19 Solutions
Bundle: Microeconomics, Loose-leaf Version, 10th + Mindtap Economics, 1 Term (6 Months) Printed Access Card

- how commond economies relate to principle Of Economics ?arrow_forwardCritically analyse the five (5) characteristics of Ubuntu and provide examples of how they apply to the National Health Insurance (NHI) in South Africa.arrow_forwardCritically analyse the five (5) characteristics of Ubuntu and provide examples of how they apply to the National Health Insurance (NHI) in South Africa.arrow_forward
- Outline the nine (9) consumer rights as specified in the Consumer Rights Act in South Africa.arrow_forwardIn what ways could you show the attractiveness of Philippines in the form of videos/campaigns to foreign investors? Cite 10 examples.arrow_forwardExplain the following terms and provide an example for each term: • Corruption • Fraud • Briberyarrow_forward
- In what ways could you show the attractiveness of a country in the form of videos/campaigns?arrow_forwardWith the VBS scenario in mind, debate with your own words the view that stakeholders are the primary reason why business ethics must be implemented.arrow_forwardThe unethical decisions taken by the VBS management affected the lives of many of their clients who trusted their business and services You are appointed as an ethics officer at Tyme Bank. Advise the management regarding the role of legislation in South Africa in providing the legal framework for business operations.arrow_forward

 Principles of Economics 2eEconomicsISBN:9781947172364Author:Steven A. Greenlaw; David ShapiroPublisher:OpenStax
 Economics (MindTap Course List)EconomicsISBN:9781337617383Author:Roger A. ArnoldPublisher:Cengage Learning

