
To explain:
The reason for high
Explanation of Solution
The reason for high price when product is introduced first in a market is shown graphically as below:
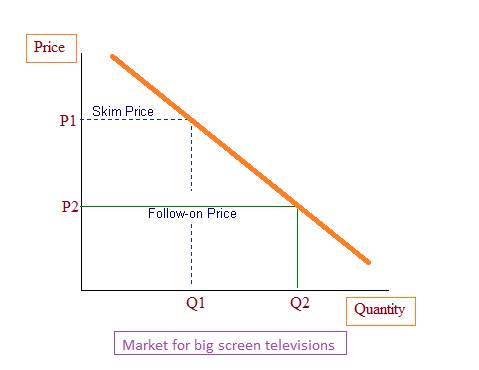
The price for big-screen televisions was high initially because whenever a new product launched in the market, the producer enjoys the benefit of least competition. A firm or producer charges a high price in order to skim the highest revenue and it lowers the price stepwise in order to generate maximum profit. The above diagram shows that the firm charges P1 price for newly introduced big screen television (Q1) and later it decreases the follow-up price by P2 and quantity Q2 in order to maximize its revenue.
Price Skimming:
Price skimming is the temporary version of
Want to see more full solutions like this?

- Critically analyse the five (5) characteristics of Ubuntu and provide examples of how they apply to the National Health Insurance (NHI) in South Africa.arrow_forwardCritically analyse the five (5) characteristics of Ubuntu and provide examples of how they apply to the National Health Insurance (NHI) in South Africa.arrow_forwardOutline the nine (9) consumer rights as specified in the Consumer Rights Act in South Africa.arrow_forward
- In what ways could you show the attractiveness of Philippines in the form of videos/campaigns to foreign investors? Cite 10 examples.arrow_forwardExplain the following terms and provide an example for each term: • Corruption • Fraud • Briberyarrow_forwardIn what ways could you show the attractiveness of a country in the form of videos/campaigns?arrow_forward
 Economics Today and Tomorrow, Student EditionEconomicsISBN:9780078747663Author:McGraw-HillPublisher:Glencoe/McGraw-Hill School Pub Co
 Exploring EconomicsEconomicsISBN:9781544336329Author:Robert L. SextonPublisher:SAGE Publications, Inc
 Managerial Economics: A Problem Solving ApproachEconomicsISBN:9781337106665Author:Luke M. Froeb, Brian T. McCann, Michael R. Ward, Mike ShorPublisher:Cengage Learning
 Survey of Economics (MindTap Course List)EconomicsISBN:9781305260948Author:Irvin B. TuckerPublisher:Cengage Learning
 Economics: Private and Public Choice (MindTap Cou...EconomicsISBN:9781305506725Author:James D. Gwartney, Richard L. Stroup, Russell S. Sobel, David A. MacphersonPublisher:Cengage Learning