
Concept explainers
Videos
1.
Cost-Volume-Profit Analysis: It is a method followed to analyze the relationship between the sales, costs, and the related profit or loss at various levels of units sold. In other words, it shows the effect of the changes in the cost and the sales volume on the operating income of the company.
To prepare: an estimated income statement for 20Y7.
1.
Explanation of Solution
Prepare an estimated income statement for 20Y7.
| Company B | |||
| Estimated Income Statement | |||
| For the year ended December 31, 20Y8 | |||
| Particulars | Amount ($) | Amount ($) | Amount ($) |
| Sales (1) | 2,880,000 | ||
| Less: Cost of Goods sold: | |||
| Direct Materials (2) | 600,000 | ||
| Direct Labor (3) | 360,000 | ||
| Factory |
422,000 | ||
| Cost of Goods Sold | (1,382,000) | ||
| Gross Profit | 1,498,000 | ||
| Less: Expenses: | |||
| Selling expenses: | |||
| Sales salaries and commissions (5) | 388,000 | ||
| Advertising | 116,000 | ||
| Travel | 4,000 | ||
| Miscellaneous selling expense (6) | 14,300 | ||
| Total selling expenses | 522,300 | ||
| Administrative expenses: | |||
| Office and Officers’ salaries | 325,000 | ||
| Supplies (7) | 54,000 | ||
| Miscellaneous administrative expenses (8) | 20,700 | ||
| Total administrative expenses | 399,700 | ||
| Total expenses | (922,000) | ||
| Income from operations | 576,000 | ||
Table (1)
Working notes:
Determine sales.
Number of units to be sold =12,000 units
Selling price per unit =$240 per unit
Determine the cost of direct materials.
Number of units to be sold =12,000 units
Direct Materials cost per unit =$50 per unit
Determine the cost of direct labor.
Number of units to be sold =12,000 units
Direct labor cost per unit =$30 per unit
Determine the cost of factory overhead.
Factory overhead-Fixed =$350,000
Number of units to be sold =12,000 units
Factory overhead-Variable cost per unit =$6 per unit
Determine the sales salaries and commissions.
Sales salaries and commissions-Fixed =$340,000
Number of units to be sold =12,000 units
Sales salaries and commissions-Variable cost per unit =$4 per unit
Determine the miscellaneous selling expense.
Miscellaneous selling expense-Fixed =$2,300
Number of units to be sold =12,000 units
Miscellaneous selling expense-Variable cost per unit =$1 per unit
Determine the supplies.
Supplies-Fixed =$6,000
Number of units to be sold =12,000 units
Supplies-Variable cost per unit =$4 per unit
Determine the miscellaneous administrative expense.
Miscellaneous administrative expense-Fixed =$8,700
Number of units to be sold =12,000 units
Miscellaneous administrative expense-Variable cost per unit =$1 per unit
2.
the expected contribution margin ratio.
2.
Explanation of Solution
Determine the expected contribution margin ratio.
Sales =$2,880,000 (1)
Variable cost =$1,152,000 (9)
Working note:
Determine the variable cost.
Number of units to be sold =12,000 units
Variable cost per unit =$96 per unit
Therefore, the expected contribution margin ratio is 60%.
3.
the break-even sales in units and dollars.
3.
Explanation of Solution
Determine the break-even sales in units.
Fixed cost =$1,152,000
Contribution margin per unit =$144 per unit (10)
Working note:
Compute the contribution margin per unit.
Selling price per unit =$240 per unit
Variable cost per unit =$96 per unit
Determine the break-even sales in dollars.
Fixed cost =$1,152,000
Contribution margin ratio =60% (refer Part 2)
Therefore, the break-even sales in units is 8,000 units and dollars is $1,920,000.
4.
To construct: a cost-volume-profit chart indicating the break-even sales.
4.
Explanation of Solution
Construct a cost-volume-profit chart indicating the break-even sales.
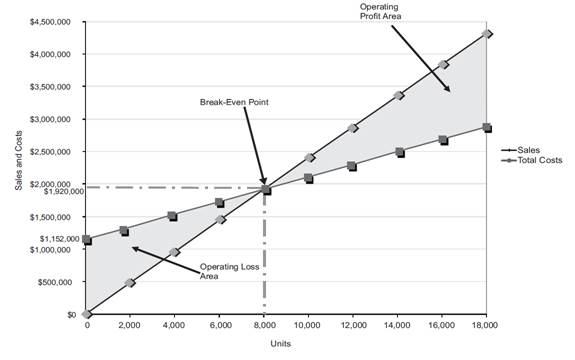
Figure (1)
The volume in units of sales is shown on the horizontal axis. The maximum relevant range is 18,000 units. The sales and the total costs (fixed cost and variable cost) in dollars is shown on the vertical axis. The maximum relevant range of sales and total costs is $4,500,000.
The total sales line is drawn right upward by connecting the first point at $0 to the second point at $4,320,000
The total cost line is drawn right upward by connecting the first point at $1,152,000 (fixed cost) on the vertical axis to the second point at
The break-even point is the intersection point where the total sales line and total cost line meet. The vertical dotted line drawn downward from the intersection point reaches at 8,000 units. It indicates the break-even sales (units). The horizontal line drawn to the left towards the vertical axis reaches at $1,920,000. It indicates the break-even sales (dollars). Refer Part 3 for the break-even values.
The operating profit area is the area where the total sales line exceeds the total cost line. However, the operating loss area is the area where the total cost exceeds the total sales line.
5.
the expected margin of safety in dollars and as a percentage of sales.
5.
Explanation of Solution
Determine the expected margin of safety in dollars.
Sales =$2,880,000 (1)
Sales at break-even point =$1,920,000 (refer Part 3)
Determine the expected margin of safety as a percentage of sales.
Sales =$2,880,000 (1)
Margin of Safety in dollars =$960,000
Therefore, the expected margin of safety in dollars is $960,000 and as a percentage of sales is 33.3%.
6.
the operating leverage.
6.
Explanation of Solution
Determine the operating leverage.
Contribution margin =$1,728,000 (11)
Income from operations =$576,000 (refer Table 1)
Working note:
Determine the contribution margin
Sales =$2,880,000 (1)
Variable cost =$1,152,000 (9)
Therefore, the operating leverage is 3.
Want to see more full solutions like this?
Chapter 19 Solutions
Bundle: Financial & Managerial Accounting, Loose-leaf Version, 14th + Working Papers For Warren/reeve/duchac's Corporate Financial Accounting, 14th + ... Financial & Managerial Accounting,


- I need guidance with this financial accounting problem using the right financial principles.arrow_forwardI need guidance with this financial accounting problem using the right financial principles.arrow_forwardData pertaining to a companyy's joint production for the current period followsarrow_forward
- Can you help me solve this general accounting problem with the correct methodology?arrow_forwardgeneral accountingarrow_forwardTOSHIBA ended the year with an inventory of $842,000. During the year, the firm purchased $5,467,000 of new inventory and the cost of goods sold reported on the income statement was $5,215,000. What was TOSHIBA's inventory at the beginning of the year?arrow_forward
- Can you solve this general accounting question with accurate accounting calculations?arrow_forwardOn January 1, 2011, Phoenix Manufacturing purchased for $875,000, equipment having a useful life of eight years and an estimated salvage value of $67,500. Phoenix has recorded monthly depreciation of the equipment on the straight-line method. On December 31, 2018, the equipment was sold for $158,000. As a result of this sale, Phoenix Manufacturing should recognize a gain of___. Help me with thisarrow_forwardAnsarrow_forward
 Managerial AccountingAccountingISBN:9781337912020Author:Carl Warren, Ph.d. Cma William B. TaylerPublisher:South-Western College Pub
 Financial And Managerial AccountingAccountingISBN:9781337902663Author:WARREN, Carl S.Publisher:Cengage Learning,
 Managerial Accounting: The Cornerstone of Busines...AccountingISBN:9781337115773Author:Maryanne M. Mowen, Don R. Hansen, Dan L. HeitgerPublisher:Cengage Learning
 College Accounting, Chapters 1-27AccountingISBN:9781337794756Author:HEINTZ, James A.Publisher:Cengage Learning,
 Principles of Accounting Volume 2AccountingISBN:9781947172609Author:OpenStaxPublisher:OpenStax College