Concept explainers
Videos
1.
Cost-Volume-Profit Analysis: It is a method followed to analyze the relationship between the sales, costs, and the related profit or loss at various levels of units sold. In other words, it shows the effect of the changes in the cost and the sales volume on the operating income of the company.
To prepare: an estimated income statement for 2016.
1.
Answer to Problem 19.6BPR
Prepare an estimated income statement for 2016.
| Company B | |||
| Estimated Income Statement | |||
| For the year ended December 31, 2016 | |||
| Particulars | Amount ($) | Amount ($) | Amount ($) |
| Sales (1) | 2,880,000 | ||
| Less: Cost of Goods sold: | |||
| Direct Materials (2) | 600,000 | ||
| Direct Labor (3) | 360,000 | ||
| Factory |
422,000 | ||
| Cost of Goods Sold | (1,382,000) | ||
| Gross Profit | 1,498,000 | ||
| Less: Expenses: | |||
| Selling expenses: | |||
| Sales salaries and commissions (5) | 388,000 | ||
| Advertising | 116,000 | ||
| Travel | 4,000 | ||
| Miscellaneous selling expense (6) | 14,300 | ||
| Total selling expenses | 522,300 | ||
| Administrative expenses: | |||
| Office and Officers’ salaries | 325,000 | ||
| Supplies (7) | 54,000 | ||
| Miscellaneous administrative expenses (8) | 20,700 | ||
| Total administrative expenses | 399,700 | ||
| Total expenses | (922,000) | ||
| Income from operations | 576,000 | ||
Table (1)
Explanation of Solution
Working notes:
Determine sales.
Number of units to be sold =12,000 units
Selling price per unit =$240 per unit
Sales =(Number of units to be sold)×(Selling price per unit)=12,000 units×$240 per unit=$2,880,000 (1)
Determine the cost of direct materials.
Number of units to be sold =12,000 units
Direct Materials cost per unit =$50 per unit
Direct Materials =(Number of units to be sold)×(Direct Materials cost per unit)=12,000 units×$50 per unit=$600,000 (2)
Determine the cost of direct labor.
Number of units to be sold =12,000 units
Direct labor cost per unit =$30 per unit
Direct Labor =(Number of units to be sold)×(Direct Labor cost per unit)=12,000 units×$30 per unit=$360,000 (3)
Determine the cost of factory overhead.
Factory overhead-Fixed =$350,000
Number of units to be sold =12,000 units
Factory overhead-Variable cost per unit =$6 per unit
Factory overhead =[Factory overhead-Fixed cost]+[(Number of units to be sold)×(Factory overhead-Variable cost per unit)]=$350,000+[12,000 units×$6 per unit]=$350,000+$72,000=$422,000 (4)
Determine the sales salaries and commissions.
Sales salaries and commissions-Fixed =$340,000
Number of units to be sold =12,000 units
Sales salaries and commissions-Variable cost per unit =$4 per unit
Sales salaries and commissions] =[Sales salaries and commissions-Fixed cost]+[(Number of units to be sold)×(Sales salaries and commissions-Variable cost per unit)]=$340,000+[12,000 units×$4 per unit]=$340,000+$48,000=$388,000 (5)
Determine the miscellaneous selling expense.
Miscellaneous selling expense-Fixed =$2,300
Number of units to be sold =12,000 units
Miscellaneous selling expense-Variable cost per unit =$1 per unit
Miscellaneous selling expense] =[Miscellaneous selling expense-Fixed cost]+[(Number of units to be sold)×(Miscellaneous selling expense-Variable cost per unit)]=$2,300+[12,000 units×$1 per unit]=$2,300+$12,000=$14,300 (6)
Determine the supplies.
Supplies-Fixed =$6,000
Number of units to be sold =12,000 units
Supplies-Variable cost per unit =$4 per unit
Supplies =[Supplies-Fixed cost]+[(Number of units to be sold)×(Supplies-Variable cost per unit)]=$6,000+[12,000 units×$4 per unit]=$6,000+$48,000=$54,000 (7)
Determine the miscellaneous administrative expense.
Miscellaneous administrative expense-Fixed =$8,700
Number of units to be sold =12,000 units
Miscellaneous administrative expense-Variable cost per unit =$1 per unit
Miscellaneous administrative expense] =[Miscellaneous administrative expense-Fixed cost]+[(Number of units to be sold)×(Miscellaneous administrative expense-Variable cost per unit)]=$8,700+[12,000 units×$1 per unit]=$8,700+$12,000=$20,700 (8)
2.
the expected contribution margin ratio.
2.
Explanation of Solution
Determine the expected contribution margin ratio.
Sales =$2,880,000 (1)
Variable cost =$1,152,000 (9)
Contribution Margin Ratio =Contribution MarginSales×100=Sales−Variable costSales×100=$2,880,000−$1,152,000$2,880,000×100=$1,728,000$2,880,000×100=60%
Working note:
Determine the variable cost.
Number of units to be sold =12,000 units
Variable cost per unit =$96 per unit
Variable cost =(Number of units to be sold)×(Variable cost per unit)=12,000 units×$96 per unit=$1,152,000 (9)
Therefore, the expected contribution margin ratio is 60%.
3.
the break-even sales in units and dollars.
3.
Explanation of Solution
Determine the break-even sales in units.
Fixed cost =$1,152,000
Contribution margin per unit =$144 per unit (10)
Break-even point in Sales(units) =Fixed CostsContribution Margin per unit=$1,152,000$144=8,000 units
Working note:
Compute the contribution margin per unit.
Selling price per unit =$240 per unit
Variable cost per unit =$96 per unit
Contribution Margin per unit =(Selling price per unit)−(Variable cost per unit)=$240 per unit−$96 per unit=$144 per unit (10)
Determine the break-even sales in dollars.
Fixed cost =$1,152,000
Contribution margin ratio =60% (refer Part 2)
Break-even point in Sales(Dollars) =Fixed CostsContribution Margin ratio=$1,152,00060%=$1,152,000×10060=$1,920,000
Therefore, the break-even sales in units is 8,000 units and dollars is $1,920,000.
4.
To construct: a cost-volume-profit chart indicating the break-even sales.
4.
Answer to Problem 19.6BPR
Construct a cost-volume-profit chart indicating the break-even sales.
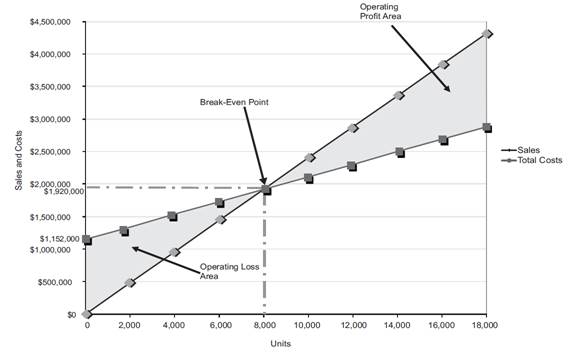
Figure (1)
Explanation of Solution
The volume in units of sales is shown on the horizontal axis. The maximum relevant range is 18,000 units. The sales and the total costs (fixed cost and variable cost) in dollars is shown on the vertical axis. The maximum relevant range of sales and total costs is $4,500,000.
The total sales line is drawn right upward by connecting the first point at $0 to the second point at $4,320,000 [18,000 units×$240 per unit] for 18,000 units (maximum relevant range on the horizontal axis).
The total cost line is drawn right upward by connecting the first point at $1,152,000 (fixed cost) on the vertical axis to the second point at $2,880,000[$1,152,000+$1,728,000] to the end of the relevant range. The variable cost is $1,728,000(18,000 units×$96 per unit).
The break-even point is the intersection point where the total sales line and total cost line meet. The vertical dotted line drawn downward from the intersection point reaches at 8,000 units. It indicates the break-even sales (units). The horizontal line drawn to the left towards the vertical axis reaches at $1,920,000. It indicates the break-even sales (dollars). Refer Part 3 for the break-even values.
The operating profit area is the area where the total sales line exceeds the total cost line. However, the operating loss area is the area where the total cost exceeds the total sales line.
5.
the expected margin of safety in dollars and as a percentage of sales.
5.
Explanation of Solution
Determine the expected margin of safety in dollars.
Sales =$2,880,000 (1)
Sales at break-even point =$1,920,000 (refer Part 3)
Margin of Safety(Dollars)=Sales−Sales at Break-Even Point=$2,880,000−$1,920,000=$960,000
Determine the expected margin of safety as a percentage of sales.
Sales =$2,880,000 (1)
Margin of Safety in dollars =$960,000
Margin of Safety(%)=Margin of Safety in dollars Sales×100=$960,000$2,880,000×100=33.3%
Therefore, the expected margin of safety in dollars is $960,000 and as a percentage of sales is 33.3%.
6.
the operating leverage.
6.
Explanation of Solution
Determine the operating leverage.
Contribution margin =$1,728,000 (11)
Income from operations =$576,000 (refer Table 1)
Operating leverage=Contribution Margin Income from operations=$1,728,000$576,000=3
Working note:
Determine the contribution margin
Sales =$2,880,000 (1)
Variable cost =$1,152,000 (9)
Contribution Margin =Sales−Variable cost=$2,880,000−$1,152,000=$1,728,000 (11)
Therefore, the operating leverage is 3.
Want to see more full solutions like this?
Chapter 19 Solutions
Bundle: Financial & Managerial Accounting, 13th + Working Papers, Volume 1, Chapters 1-15 For Warren/reeve/duchac’s Corporate Financial Accounting, ... 13th + Cengagenow™v2, 2 Terms Access Code


- Here are comparative balance sheets for Concord Company. CONCORD COMPANY Comparative Balance Sheets December 31 Assets 2022 2021 Cash $81,760 $24,640 Accounts receivable 97,440 85,120 Inventories 190,400 213,920 Land 80,640 112,000 Equipment 291,200 224,000 Accumulated depreciation (73,920) (35,840) Total $667,520 $623,840 Liabilities and Stockholders' Equity Accounts payable $41,440 $52,640 Bonds payable 168,000 235,200 Common stock ($1 par) 241,920 194,880 Retained earnings 216,160 141,120 Total $667,520 $623,840 Additional information: 1. Net income for 2022 was $112,000. 2. Cash dividends of $36,960 were declared and paid. 3. Bonds payable amounting to $67,200 were redeemed for cash $67,200. 4. Common stock was issued for $47,040 cash. 5. Equipment that cost $56,000 and had a book value of $33,600 was sold for $40,320 during 2022; land was sold at cost.arrow_forwardSolve this Accounting problemarrow_forwardWhat is the amount of shareholders equity?arrow_forward
 Managerial AccountingAccountingISBN:9781337912020Author:Carl Warren, Ph.d. Cma William B. TaylerPublisher:South-Western College Pub
 Financial And Managerial AccountingAccountingISBN:9781337902663Author:WARREN, Carl S.Publisher:Cengage Learning,
 Cornerstones of Cost Management (Cornerstones Ser...AccountingISBN:9781305970663Author:Don R. Hansen, Maryanne M. MowenPublisher:Cengage Learning
 Principles of Accounting Volume 2AccountingISBN:9781947172609Author:OpenStaxPublisher:OpenStax College
 College Accounting, Chapters 1-27AccountingISBN:9781337794756Author:HEINTZ, James A.Publisher:Cengage Learning,