1.
Cost-Volume-Profit Analysis: It is a method followed to analyze the relationship between the sales, costs, and the related profit or loss at various levels of units sold. In other words, it shows the effect of the changes in the cost and the sales volume on the operating income of the company.
To construct: a cost-volume-profit chart indicating the break-even sales for last year.
1.
Explanation of Solution
Construct a cost-volume-profit chart indicating the break-even sales for last year.
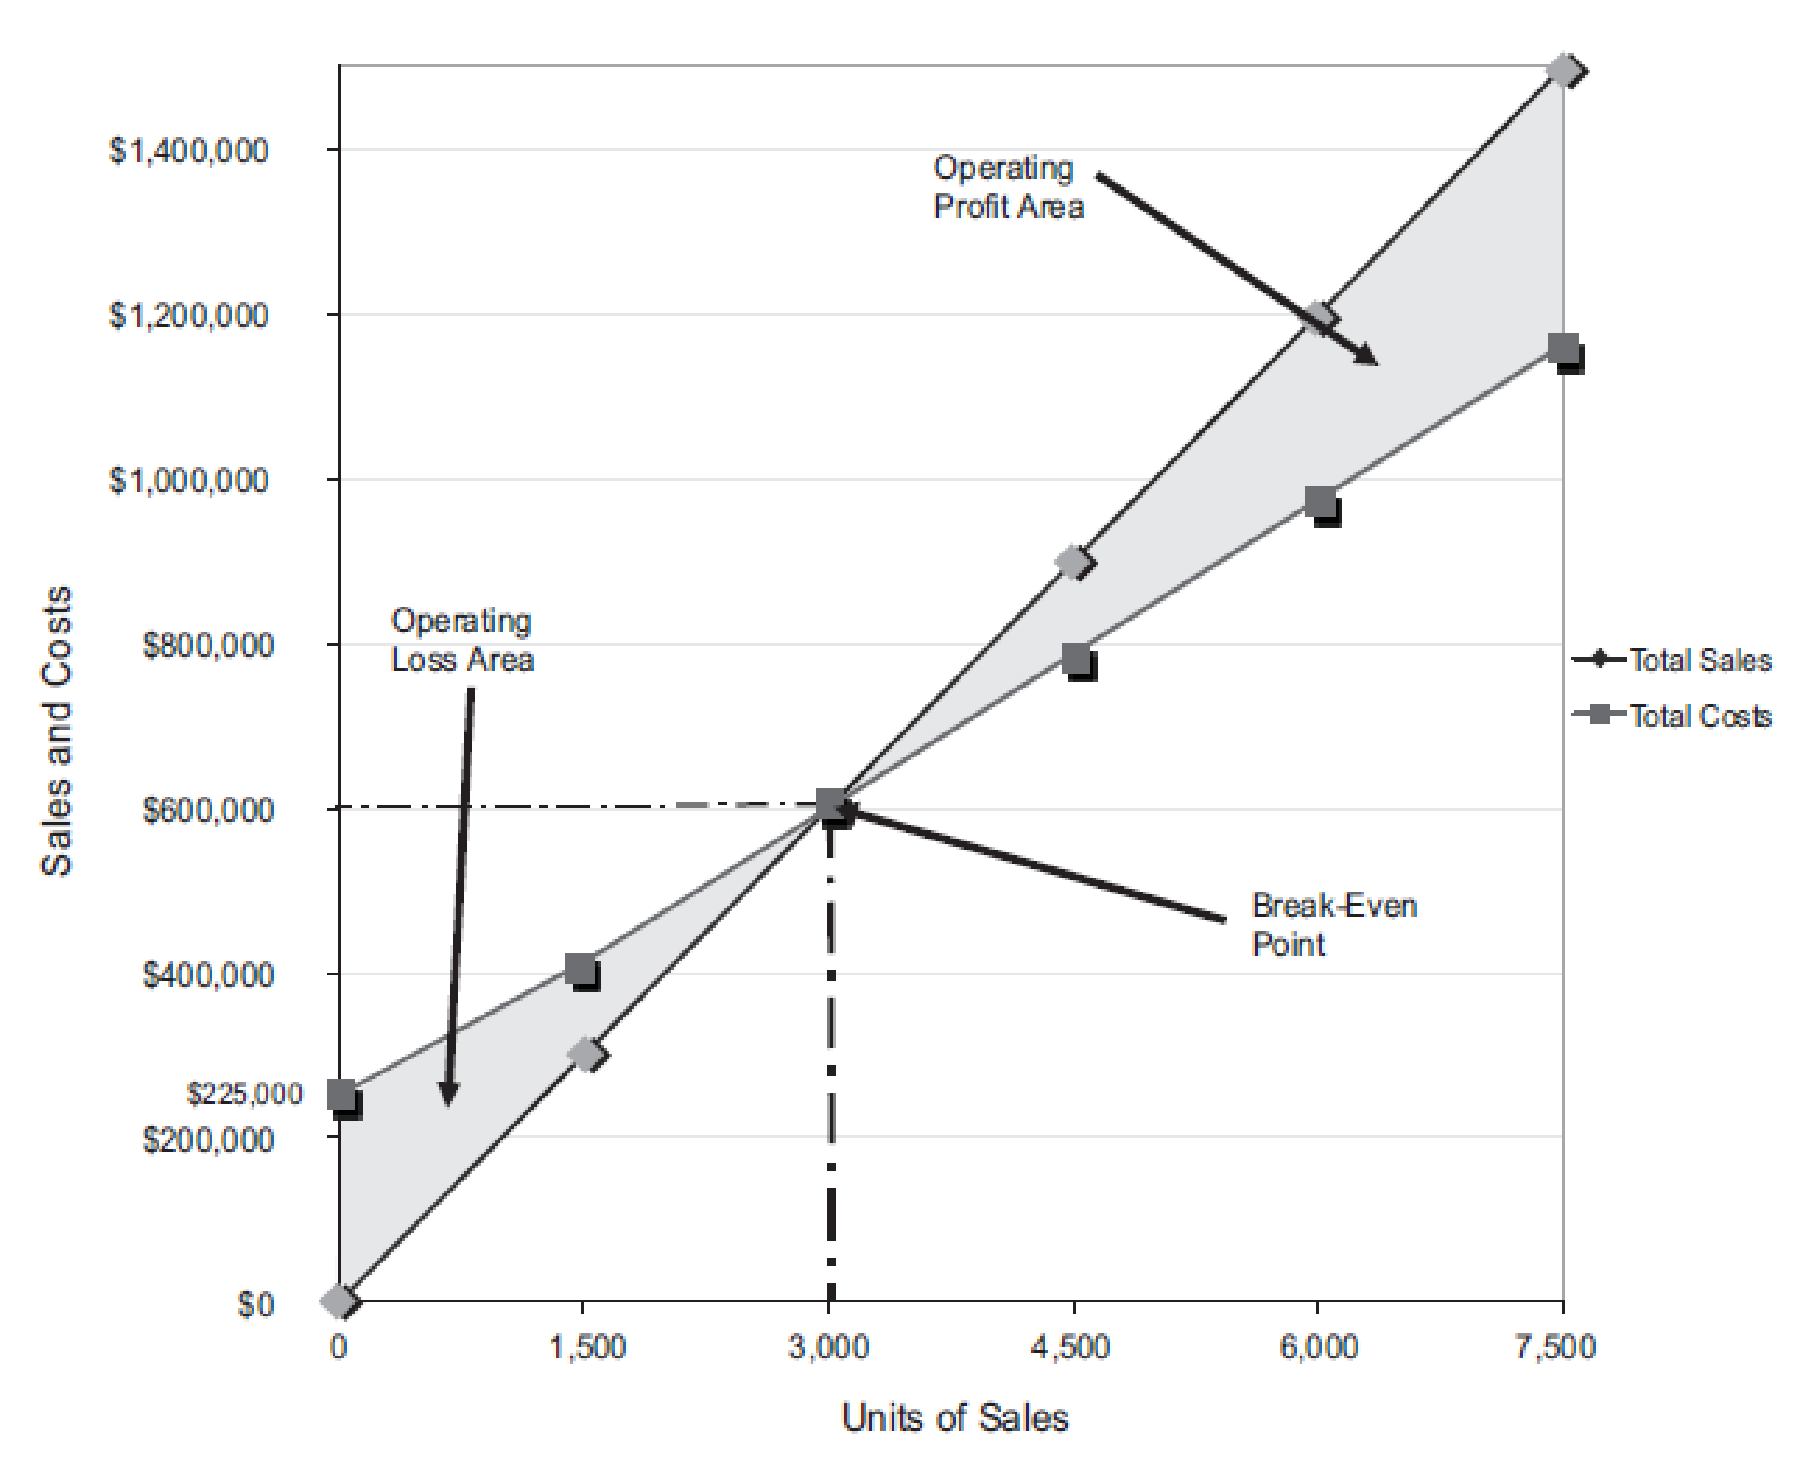
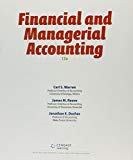
Figure (1)
The volume in units of sales is shown on the horizontal axis. The maximum relevant range is 7,500 units. The sales and the total costs (fixed cost and variable cost) in dollars is shown on the vertical axis. The maximum relevant range of sales and total costs is $1,500,000.
The total sales line is drawn right upward by connecting the first point at $0 to the second point at $1,500,000
The total cost line is drawn right upward by connecting the first point at $225,000 (fixed cost) on the vertical axis to the second point at $1,162,500
The break-even point is the intersection point where the total sales line and total cost line meet. The vertical dotted line drawn downward from the intersection point reaches at 3,000 units. It indicates the break-even sales (units). The horizontal line drawn to the left towards the vertical axis reaches at $600,000. It indicates the break-even sales (dollars).
The operating profit area is the area where the total sales line exceeds the total cost line. However, the operating loss area is the area where the total cost exceeds the total sales line.
Verify the answer using the break-even equation.
Determine the break-even sales in units.
Fixed cost =$225,000
Contribution margin per unit =$75 per unit (1)
Working note:
Compute the contribution margin per unit.
Selling price per unit =$200 per unit
Variable cost per unit =$125 per unit
Determine the break-even sales in dollars.
Fixed cost =$225,000
Contribution margin ratio =37.5% (2)
Working note:
Determine the contribution margin ratio.
Contribution margin =$75 per unit (1)
Selling price per unit =$200 per unit
2.
(A) the income from operations for last year and (B) the maximum income from operations that could have been realized during the year using the cost-volume-profit chart..
2.
Explanation of Solution
Determine (A) the income from operations for last year and (B) the maximum income from operations that could have been realized during the year.
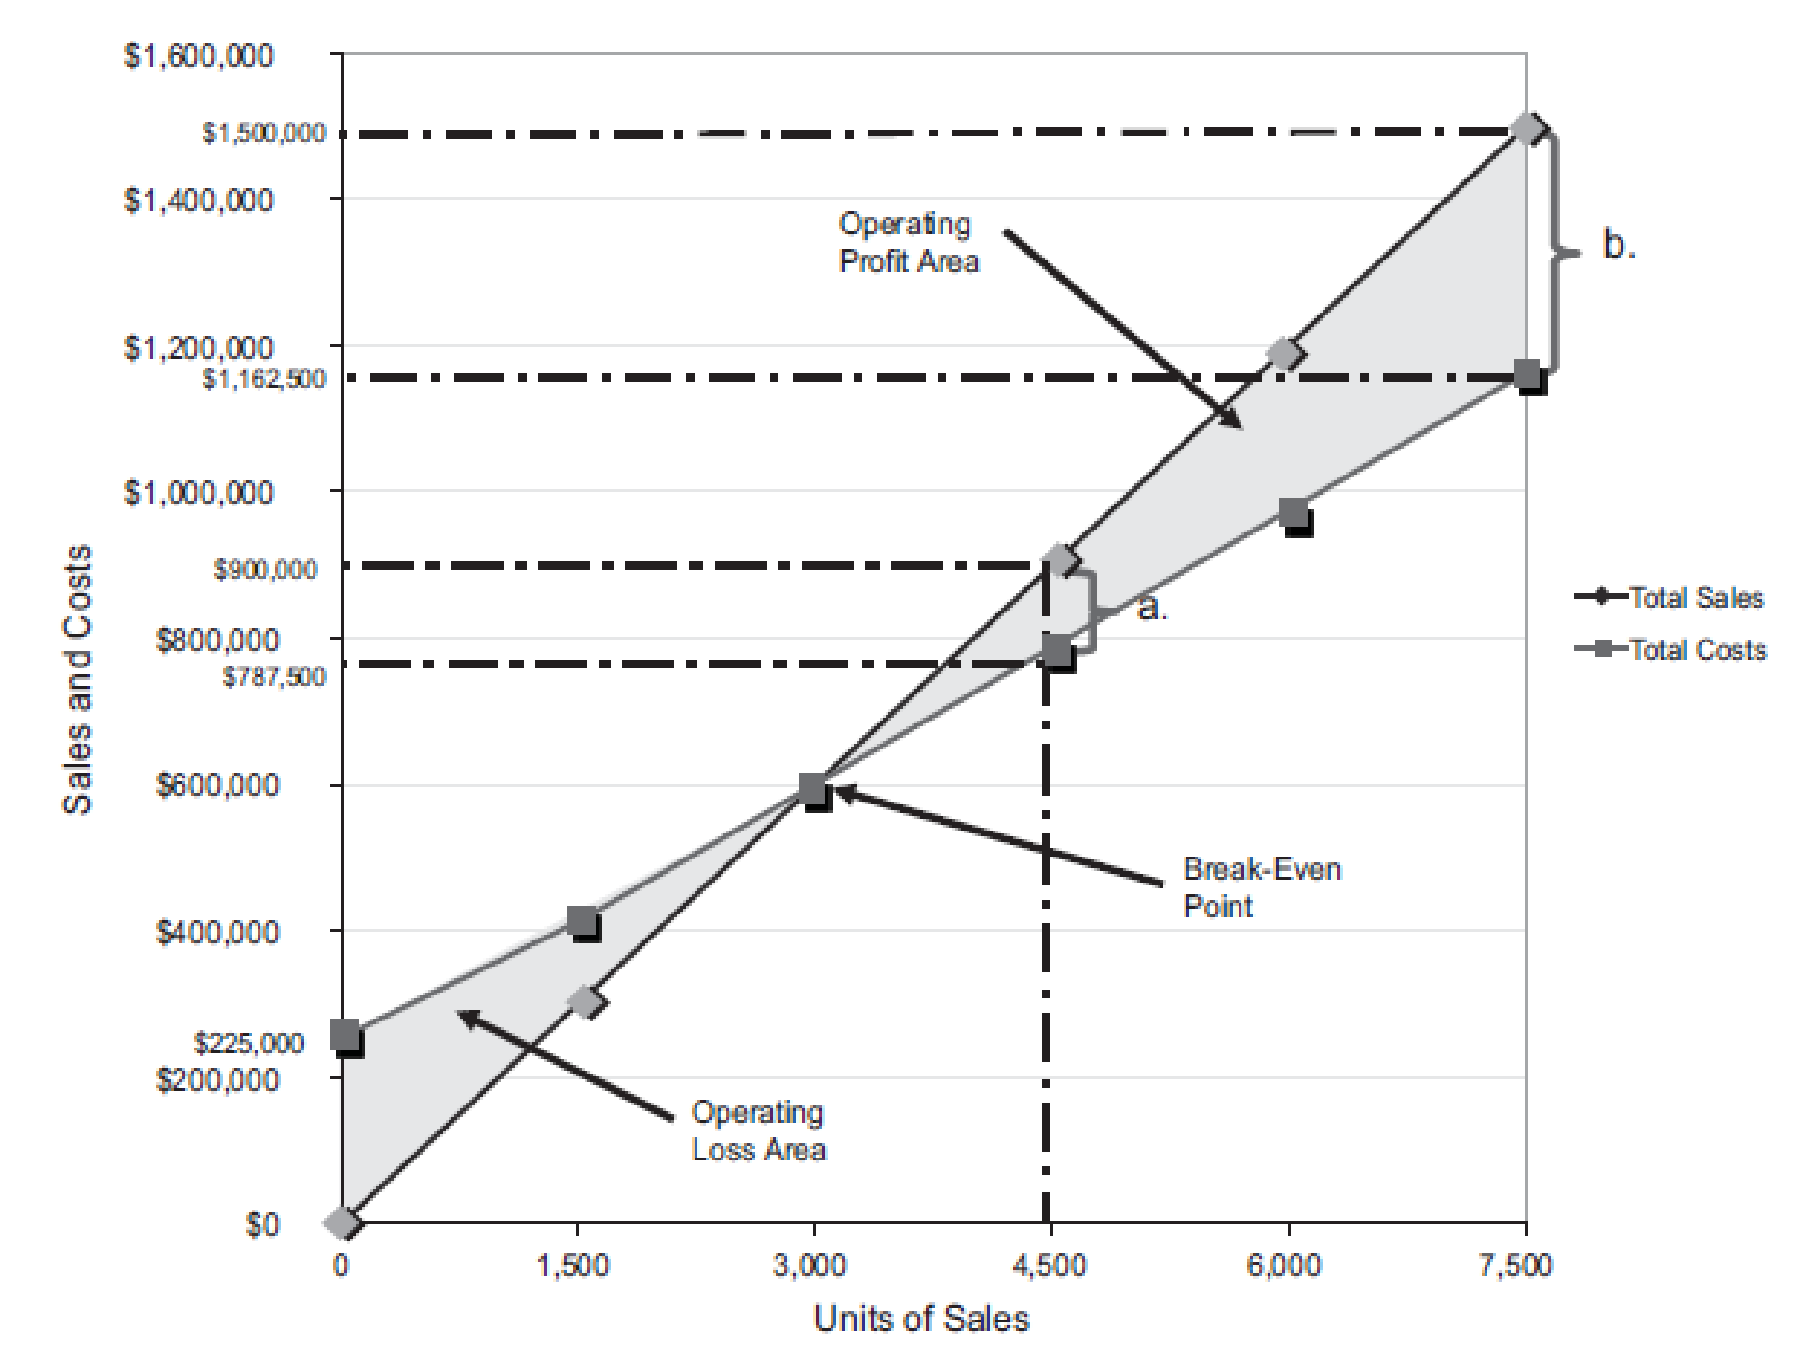
Figure (2)
(A)
Last year, the number of units sold is 4,500 units (3). The total sales is $900,000. The total cost is
Similarly, a dotted line is drawn from the total cost at $787,500 on the vertical axis towards the right and a dotted line is drawn upward for the 4,500 units sold from the horizontal axis. The two dotted line meet at a point which indicates the point of total cost at 4,500 units.
The dotted line from sales is above the dotted line for total cost. This indicates the income from operations. Thus, the area in between the two dotted lines is the income from operations of
(B)
The maximum relevant range for number of units to be sold is 7,500 units. Thus, the total sales are
Similarly, a dotted line is drawn from the total cost at $1,162,500 on the vertical axis towards the right and a dotted line is drawn upward for the 7,500 units sold from the horizontal axis. The two dotted line meet at a point which indicates the point of total cost at 7,500 units.
The dotted line from sales is above the dotted line for total cost. This indicates the income from operations. Thus, the area in between the two dotted lines is the income from operations of
Verify the answers using the mathematical approach to cost-volume-profit analysis.
(A)
Determine the income from operations for the last year.
| Determine the income from operations for 4,500 units | ||
| Particulars | Amount ($) | Amount ($) |
| Sales | 900,000 | |
| Less: Fixed costs | 225,000 | |
| Variable costs | 562,500 | (787,500) |
| Income from operations | 112,500 | |
Table (1)
Working note (3):
Determine the number of units sold.
Sales =$900,000
Selling price per unit =$200 per unit
(B)
Determine the maximum income from operations that could have been realized during the year.
| Determine the income from operations for 7,500 units | ||
| Particulars | Amount ($) | Amount ($) |
| Sales | 1,500,000 | |
| Less: Fixed costs | 225,000 | |
| Variable costs | 937,500 | (1,162,500) |
| Income from operations | 337,500 | |
Table (2)
3.
To construct: a cost-volume-profit chart indicating the break-even sales for the current year.
3.
Explanation of Solution
Construct a cost-volume-profit chart indicating the break-even sales for the current year.
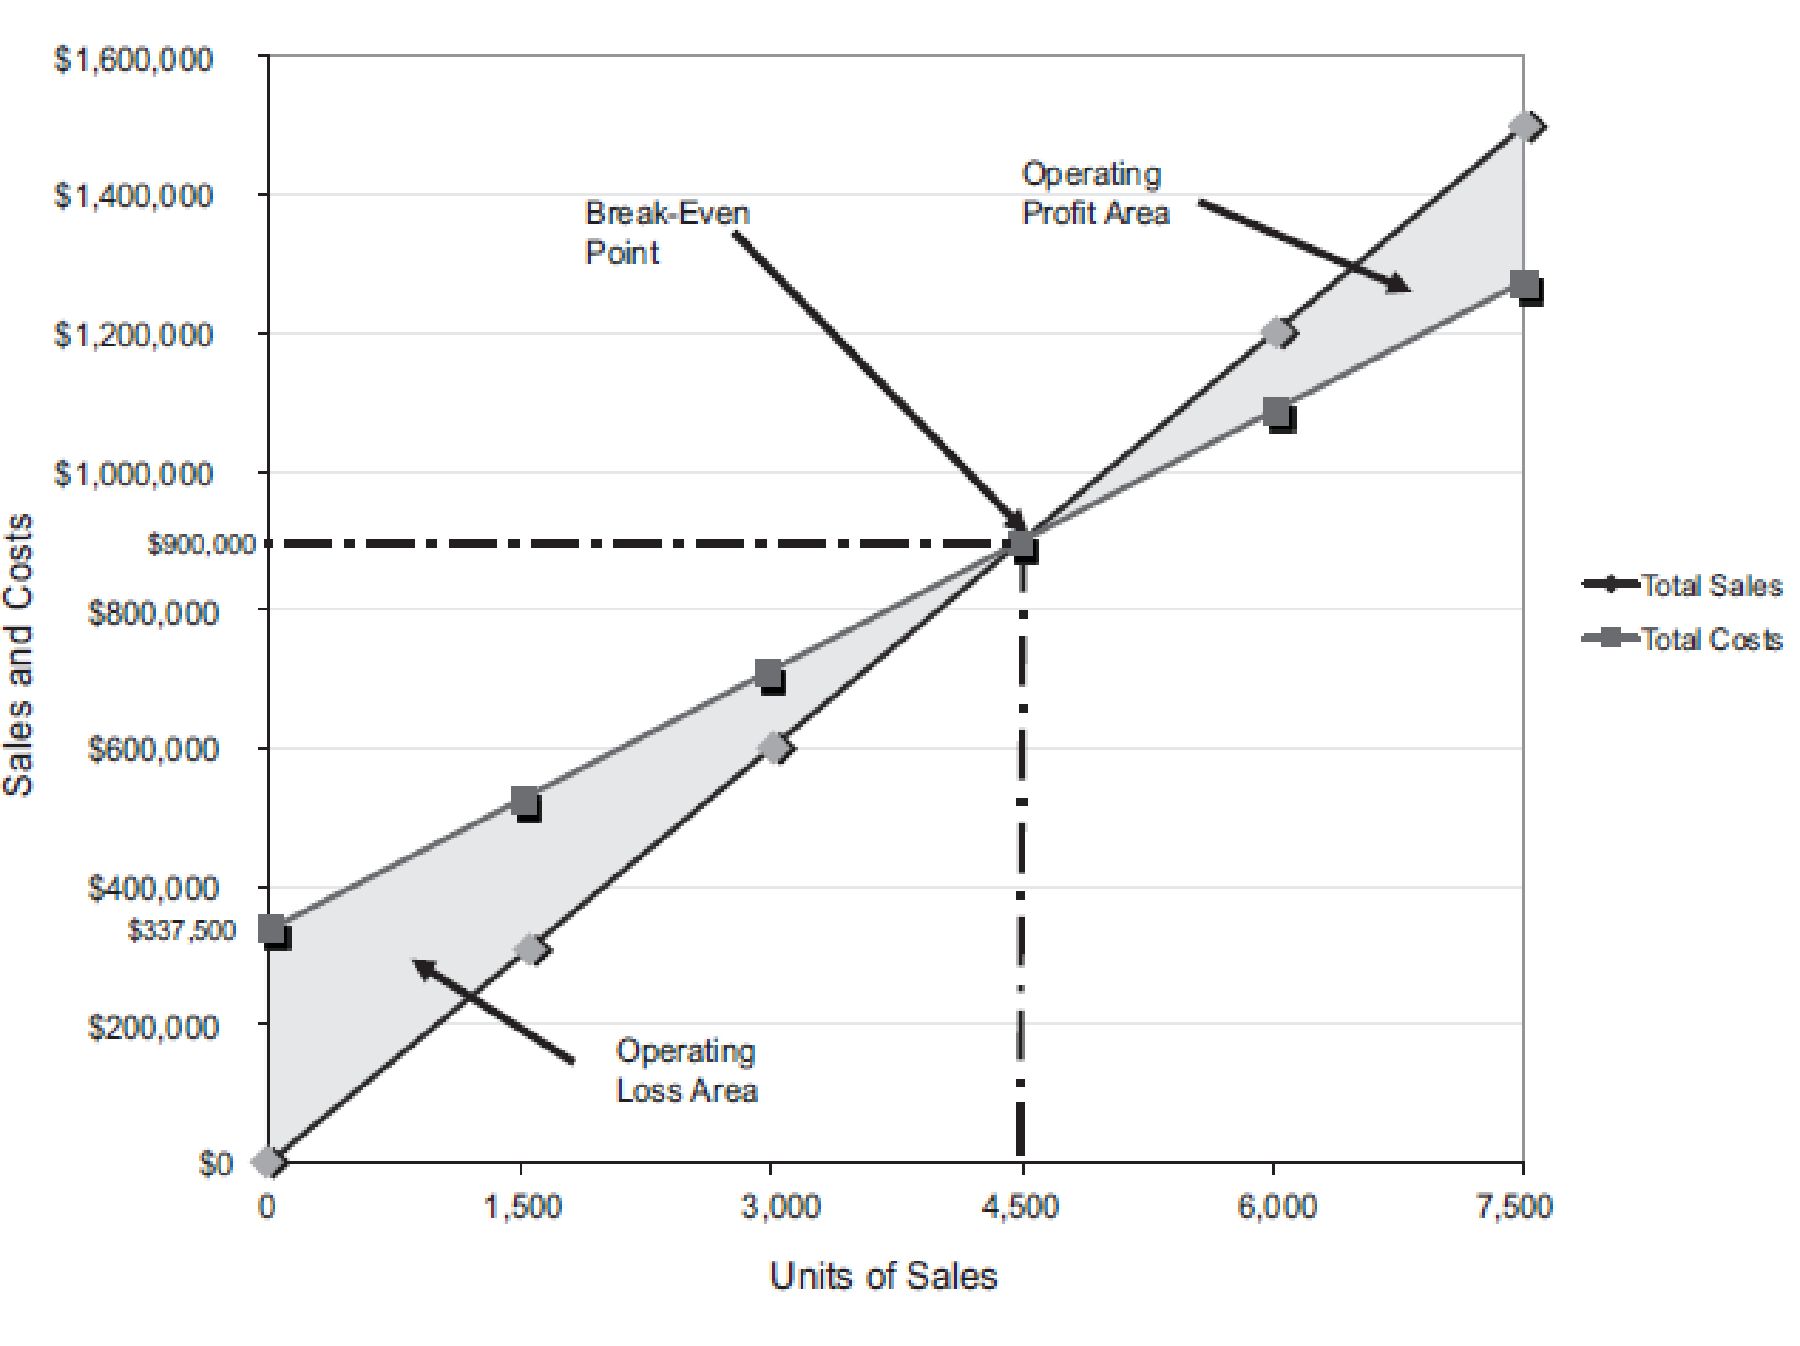
Figure (3)
The volume in units of sales is shown on the horizontal axis. The maximum relevant range is 7,500 units. The sales and the total costs (fixed cost and variable cost) in dollars is shown on the vertical axis. The maximum relevant range of sales and total costs is $1,600,000.
The total sales line is drawn right upward by connecting the first point at $0 to the second point at $900,000
The total cost line is drawn right upward by connecting the first point at
The break-even point is the intersection point where the total sales line and total cost line meet. The vertical dotted line drawn downward from the intersection point reaches at 4,500 units. It indicates the break-even sales (units). The horizontal line drawn to the left towards the vertical axis reaches at $900,000. It indicates the break-even sales (dollars).
The operating profit area is the area where the total sales line exceeds the total cost line. However, the operating loss area is the area where the total cost exceeds the total sales line.
Verify the answer using the break-even equation.
Determine the break-even sales in units.
Fixed cost =$225,000
Increase in fixed cost (billboard advertising) =$112,500
Contribution margin per unit =$75 per unit (1)
Determine the break-even sales in dollars.
Fixed cost =$225,000
Increase in fixed cost (billboard advertising) =$112,500
Contribution margin ratio =37.5% (2)
4.
(A) the income from operations for sales 6,000 units and (B) the maximum income from operations that could have been realized during the year using the cost-volume-profit chart..
4.
Explanation of Solution
Determine (A) the income from operations for sales 6,000 units and (B) the maximum income from operations that could have been realized during the year.
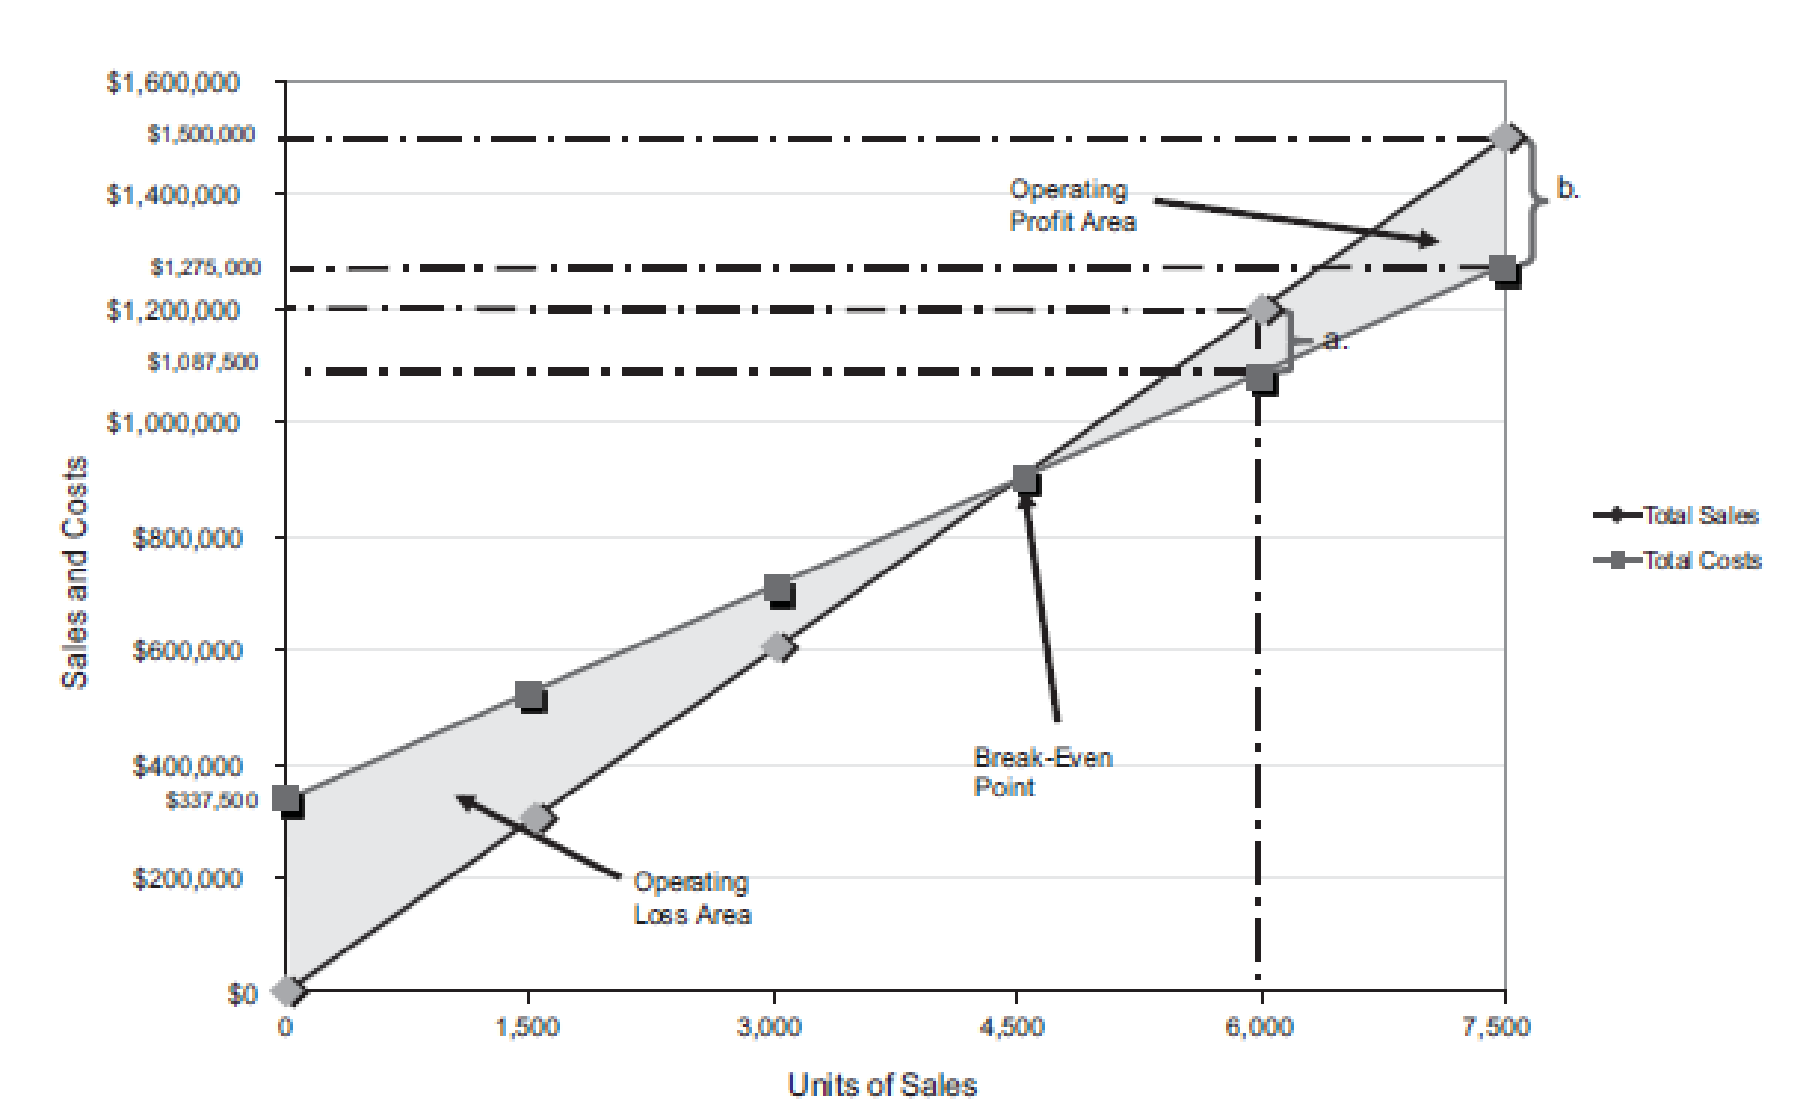
Figure (4)
(A)
The number of units sold is 6,000 units. The total sales is
Similarly, a dotted line is drawn from the total cost at $1,087,500 on the vertical axis towards the right and a dotted line is drawn upward for the 6,000 units sold from the horizontal axis. The two dotted line meet at a point which indicates the point of total cost at 6,000 units.
The dotted line from sales is above the dotted line for total cost. This indicates the income from operations. Thus, the area in between the two dotted lines is the income from operations of
(B)
The maximum relevant range for number of units to be sold is 7,500 units. Thus, the total sales are
Similarly, a dotted line is drawn from the total cost at $1,275,000 on the vertical axis towards the right and a dotted line is drawn upward for the 7,500 units sold from the horizontal axis. The two dotted line meet at a point which indicates the point of total cost at 7,500 units.
The dotted line from sales is above the dotted line for total cost. This indicates the income from operations. Thus, the area in between the two dotted lines is the income from operations of
Verify the answers using the mathematical approach to cost-volume-profit analysis.
(A)
Determine the income from operations for the last year.
| Determine the income from operations for 6,000 units | ||
| Particulars | Amount ($) | Amount ($) |
| Sales | 1,200,000 | |
| Less: Total Fixed costs | 337,500 | |
| Variable costs | 750,000 | (1,087,500) |
| Income from operations | 112,500 | |
Table (3)
(B)
Determine the maximum income from operations that could have been realized during the year.
| Determine the income from operations for 7,500 units | ||
| Particulars | Amount ($) | Amount ($) |
| Sales | 1,500,000 | |
| Less: Total Fixed costs | 337,500 | |
| Variable costs | 937,500 | (1,275,000) |
| Income from operations | 225,000 | |
Table (4)
Want to see more full solutions like this?
Chapter 19 Solutions
Bundle: Financial & Managerial Accounting, Loose-leaf Version, 13th + CengageNOWv2, 1 term (6 months) Printed Access Card Corporate Financial ... Access Card for Managerial Accounting, 13th

- Hello tutor please provide correct answer general accounting questionarrow_forwardRobinson Manufacturing discovered the following information in its accounting records: $519,800 in direct materials used, $223,500 in direct labor, and $775,115 in manufacturing overhead. The Work in Process Inventory account had an opening balance of $72,400 and a closing balance of $87,600. Calculate the company’s Cost of Goods Manufactured.arrow_forwardSanjay would like to organize HOS (a business entity) as either an S corporation or as a corporation (taxed as a C corporation) generating a 16 percent annual before-tax return on a $350,000 investment. Sanjay’s marginal tax rate is 24 percent and the corporate tax rate is 21 percent. Sanjay’s marginal tax rate on individual capital gains and dividends is 15 percent. HOS will pay out its after-tax earnings every year to either its members or its shareholders. If HOS is taxed as an S corporation, the business income allocation would qualify for the deduction for qualified business income (assume no limitations on the deduction). Assume Sanjay does not owe any additional Medicare tax or net investment income tax. Required 1. For each scenario, C corporation and S corporation, calculate the total tax (entity level and owner level). 2. For each scenario, C corporation and S corporation, calculate the effective tax rate. C Corporation S Corporation 1. Total tax…arrow_forward
- I need correct solution of this general accounting questionarrow_forwardHii expert please given correct answer general accountingarrow_forwardMarkowis Corp has collected the following data concerning its maintenance costs for the pest 6 months units produced Total cost July 18,015 36,036 august 37,032 40,048 September 36,036 55,055 October 22,022 38,038 November 40,040 74,575 December 38,038 62,062 Compute the variable coot per unit using the high-low method. (Round variable cost per mile to 2 decimal places e.g. 1.25) Compute the fixed cost elements using the high-low method.arrow_forward
- Use the following data to determine the total dollar amount of assets to be classified as current assets. Marigold Corp. Balance Sheet December 31, 2025 Cash and cash equivalents Accounts receivable Inventory $67000 Accounts payable $126000 86500 Salaries and wages payable 11100 149000 Bonds payable 161500 Prepaid insurance 83000 Total liabilities 298600 Stock investments (long-term) 193000 Land 199500 Buildings $226000 Common stock 309400 Less: Accumulated depreciation (53500) 172500 Retained earnings 475500 Trademarks 133000 Total stockholders' equity 784900 Total assets $1083500 Total liabilities and stockholders' equity $1083500 ○ $269100 $385500 ○ $236500 ○ $578500arrow_forwardShould the machine be replaced?arrow_forwardUsing the following balance sheet and income statement data, what is the total amount of working capital? Current assets $39700 Net income $52100 Current liabilities 19800 Stockholders' equity 96700 Average assets 198400 Total liabilities 52100 Total assets 148800 Average common shares outstanding was 18600. ○ $9900 ○ $39700 ○ $19900 ○ $12400arrow_forward
- Suppose that Old Navy has assets of $4265000, common stock of $1018000, and retained earnings of $659000. What are the creditors' claims on their assets? ○ $2588000 ○ $3906000 ○ $1677000 ○ $4624000arrow_forwardBrody Corp. uses a process costing system. Beginning inventory for January consisted of 1,400 units that were 46% completed. 10,300 units were started during January. On January 31, the inventory consisted of 550 units that were 77% completed. How many units were completed during the period?arrow_forwardCurrent Attempt in Progress Whispering Winds Corp. has five plants nationwide that cost $275 million. The current fair value of the plants is $460 million. The plants will be reported as assets at $735 million. O $460 million. $275 million. O $185 million.arrow_forward
 Cornerstones of Cost Management (Cornerstones Ser...AccountingISBN:9781305970663Author:Don R. Hansen, Maryanne M. MowenPublisher:Cengage Learning
 Excel Applications for Accounting PrinciplesAccountingISBN:9781111581565Author:Gaylord N. SmithPublisher:Cengage Learning