Concept explainers
a.
To calculate: The amount of FCFE per share for the year 2016 using the data given in the table.
Introduction:
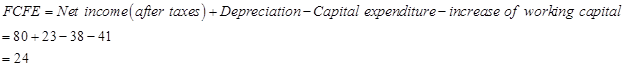
FCFE: When expanded, it is
a.
Answer to Problem 3CP
The free cash flow earning(FCFE) per share will be
Explanation of Solution
The information given to us is as follows:
Table 18A
Sundanci actual 2010 and 2011 financial statements
for fiscal years ending May 31
(Amount in million $, except per share data)
| Income statement | 2010 | 2011 |
| Revenue |  |  |
 | 23 | |
| Other operating costs |  |  |
| Income before taxes |  |  |
| Taxes |  |  |
| Net Income |  |  |
| Dividends |  |  |
| Earnings per share |  |  |
| Dividend per share |  |  |
| Common shares outstanding (millions) |  |  |
| 2010 | 2011 | |
| Current assets |  |  |
| Net property, plant and equipment |  |  |
| Total assets |  |  |
| Current liabilities |  |  |
| Long term debt | 0 | 0 |
| Total liabilities |  |  |
| Shareholder’s equity |  |  |
| Total liabilities and equity |  |  |
| Capital expenditures |  |  |
Sundanci FCFE will grow at  for two year and
  thereafter.
Capital expenditures, depreciation and working capital are expected to increase proportionately with FCFE.
Note 1: Calculation of increase in working capital:

Therefore, when there is an increase in working capital, it implies that the there is an increase in current assets and current liabilities.
Let us now calculate the increase in working capital.

The value of currents assets has increased from Similarly, even the current liabilities have increased from
  million dollars. So, let us consider the difference amounts for calculations.
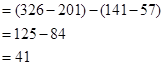
Therefore the net increase in working capital will be
Calculation of FCFE per share:
 Number of outstanding shares=84 (as per the given information.)
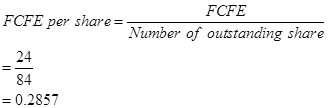
or 0.286 when rounded off.
Therefore, free cash flow equity per share will be
b.
To calculate: The current value of a share of Sundanci stock using the two-stage FCFE model.
Introduction:
DDM model: DDM model refers to
b.
Answer to Problem 3CP
The current value of the share is
Explanation of Solution
The information given to us is as follows:
Table 18A
Sundanci actual 2010 and 2011 financial statements
for fiscal years ending May 31
(Amount in million $, except per share data)
| Income statement | 2010 | 2011 |
| Revenue |  |  |
| Depreciation |  |  |
| Other operating costs |  |  |
| Income before taxes |  |  |
| Taxes |  |  |
| Net Income |  |  |
| Dividends |  |  |
| Earnings per share |  |  |
| Dividend per share |  |  |
| Common shares outstanding (millions) |  |  |
| Balance sheet | 2010 | 2011 |
| Current assets |  |  |
| Net property, plant and equipment | 474 | 489 |
| Total assets | 675 | 815 |
| Current liabilities | 57 | 141 |
| Long term debt | 0 | 0 |
| Total liabilities | 57 | 141 |
| Shareholder’s equity | 618 | 674 |
| Total liabilities and equity | 675 | 815 |
| Capital expenditures | 34 | 38 |
Sundanci FCFE will grow at 27% for two year and 13% thereafter.
Capital expenditures, depreciation and working capital are expected to increase proportionately with FCFE.
Usage of two-stage FCFE model is simple. We have to first calculate the FCFE per share in the year 2012 and 2013. We have to proceed with calculation using the given information that there is a growth rate of 27%. Then, we have to calculate the terminal value in 2013 which has a continuous growth of 13%. Finally, this value has to be discounted at current period by the required
Let us now calculate the current value of a share.
| Income statement | Actual | Estimated | |||
| 2011 | 2012 | 2013 | 2014 | ||
| Growth
rate | 27%- | 27% | 13% | ||
| Per share value | Per share value | Per share value | |||
| Net
Income | 80 |  | 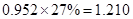 | 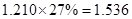 | 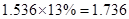 |
| Add: Depreciation | 23 |  | 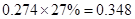 |  | 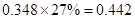 |
| Less:
Capital expenditure | -38 |  | 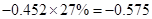 | 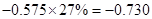 | 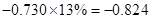 |
| Less: Increase in working capital | -41 |  | 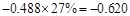 | 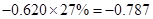 | 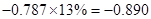 |
| FCFE | 24 |  | 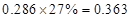 | 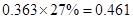 | 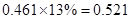 |
Let us now calculate the terminal value.

The rate of return 14% and perpetuity dividends 13% are converted into decimals by dividing it by 100.

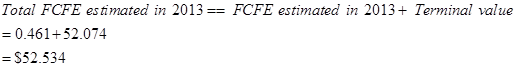
Having done, let us now calculate the total FCFE estimated in 2013.
Let us now discount the FCFE to derive the FCFE per share value.
Since, we are given that the required rate of return is 14%, let us use the PV factor of 14% 
So, when we are calculating the PV factor for 2012, it will be 1.
For 2013 PV factor= 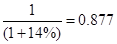
For 2014 PV factor= 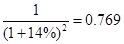
So, now we have to calculate the discounted value.

For 2013 Discounted value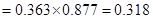
For 2014 discounted value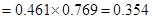
Therefore, the current value of the share=40.742.
c.
To describe: The limitation of two-state DDM model calculated by using and than by not using the two-stage FCFE model.
Introduction:
DDM Model: DDM model refers to dividend discount model. It is supposed to be a quantitative method useful in estimating the company’s stock price.
c.
Answer to Problem 3CP
The assumption of continuous growth sounds unrealistic resulting in a number of limitations on usage.
Explanation of Solution
The whole concept of DDM is based on the theory that the present- day’s price is worth the sum of all of its future dividend payments which are later discounted back to is
- The shares of a company cannot be valued using DDM model since distribution of dividends is not possible. With the help of FCFE model, the value of the firm can be predicted even though dividends are not distributed.
- When both models i.e., FCFE model and DDM, we can observe one thing. The assumption of continuous growth rate sounds unrealistic. Practically seen, the growth rate keeps on changing and it is highly impossible for it to be stable for a long time. Estimation of the time when the growth rate will be constant is not possible. This results in difficulty in calculation of required rate of return.
Want to see more full solutions like this?
Chapter 18 Solutions
Investments, 11th Edition (exclude Access Card)


- A brief introduction and overview of the company"s (a) uk vodaphone -300word history and current position in respective marketplace.A graphical illustration, together with a short written summary, of the five year trends in sales, profits,costs and dividends paid-100wordarrow_forwardA brief introduction and overview of the company"s (a) uk vodaphone (b) uk Hsbc bank, (c)uk coca-cola history and current position in respective marketplace.arrow_forwardKing’s Park, Trinidad is owned and operated by a private company,Windy Sports Ltd. You work as the Facilities Manager of the Park andthe CEO of the company has asked you to evaluate whether Windy shouldembark on the expansion of the facility given there are plans by theGovernment to host next cricket championship.The project seeks to increase the number of seats by building fournew box seating areas for VIPs and an additional 5,000 seats for thegeneral public. Each box seating area is expected to generate $400,000in incremental annual revenue, while each of the new seats for thegeneral public will generate $2,500 in incremental annual revenue.The incremental expenses associated with the new boxes and seatingwill amount to 60 percent of the revenues. These expenses includehiring additional personnel to handle concessions, ushering, andsecurity. The new construction will cost $15 million and will be fullydepreciated (to a value of zero dollars) on a straight-line basis overthe 5-year…arrow_forward
- You are called in as a financial analyst to appraise the bonds of Ollie’s Walking Stick Stores. The $5,000 par value bonds have a quoted annual interest rate of 8 percent, which is paid semiannually. The yield to maturity on the bonds is 12 percent annual interest. There are 12 years to maturity. a. Compute the price of the bonds based on semiannual analysis. b. With 8 years to maturity, if yield to maturity goes down substantially to 6 percent, what will be the new price of the bonds?arrow_forwardLonnie is considering an investment in the Cat Food Industries. The $10,000 par value bonds have a quoted annual interest rate of 12 percent and the interest is paid semiannually. The yield to maturity on the bonds is 14 percent annual interest. There are seven years to maturity. Compute the price of the bonds based on semiannual analysis.arrow_forwardNeed solution this wuarrow_forward

 Fundamentals Of Financial Management, Concise Edi...FinanceISBN:9781337902571Author:Eugene F. Brigham, Joel F. HoustonPublisher:Cengage Learning
 Pfin (with Mindtap, 1 Term Printed Access Card) (...FinanceISBN:9780357033609Author:Randall Billingsley, Lawrence J. Gitman, Michael D. JoehnkPublisher:Cengage Learning